
Date: 2026-01-18 Page is: DBtxt003.php L0300-Inequality
|
SOCIAL ISSUES
INEQUALITY Getting worse for decades ... since the Reagan administration |
| HOME | BRIEFS | L07-01-SEES-OVERVIEW | L0700-SN-02-TVM-MANAGEMENT |
|
|
| . |
| . |
|
THERE ARE MANY MANIFESTATION OF THE PROBLEM
|
PRODUCTIVITY UP ... BUT NOT WAGES
| 
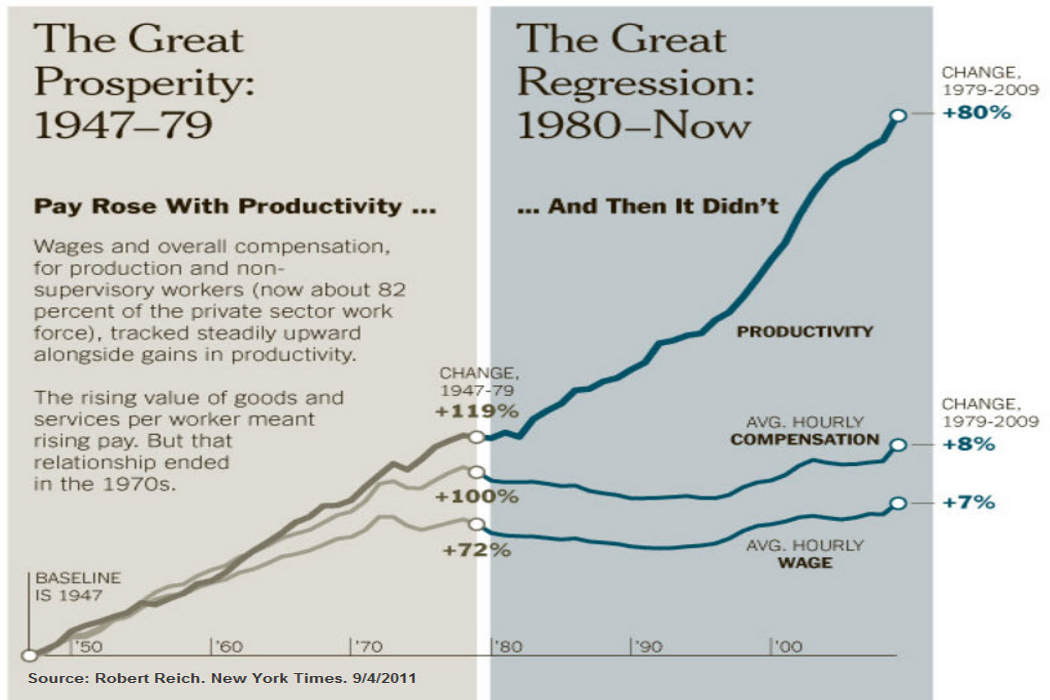
There has been a continuum of productivity improvement from 1947, soon after the end of the Second World War to the present time, but there has not been the same continuum of wage improvement for the people who work for a living. This graphic from Robert Reich in 2011 and shows how productivity and wages had the same trajectory of improvement from 1947 until the 1970s ... an era of 'Great Prosperity' but from 1980 to the present time (2011), productivity continued its improvement but wages flatlined ... an era of 'Great Regression'.
|
| UNION MEMBERSHIP & WAGES
| 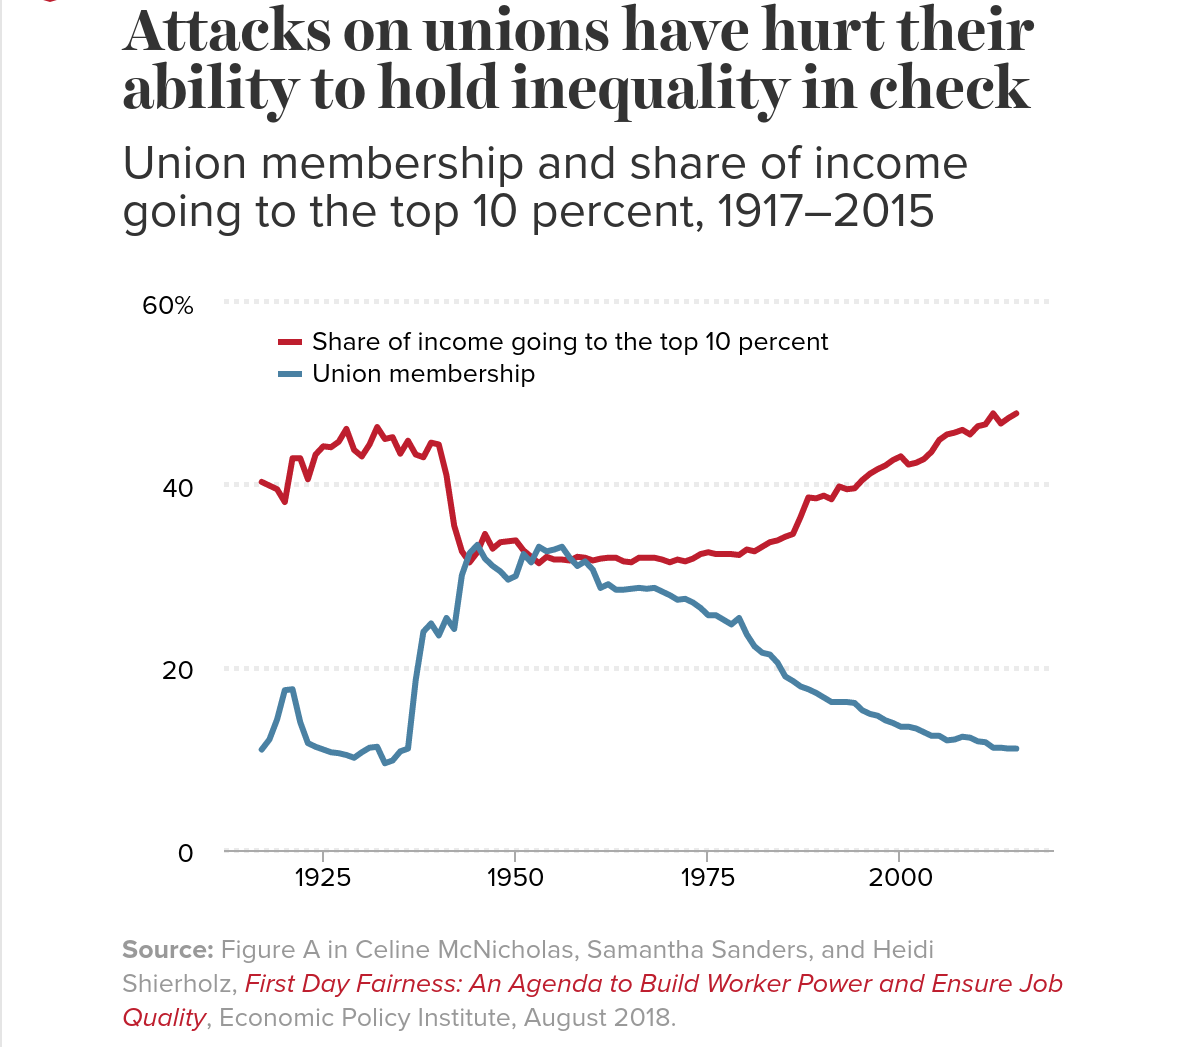
During WWII there was a substantial increase in Union membership and the share of wages going to workers increased significantly.
| This share was stable for about 25 years after the war. Things changed with the OPEC oil shock of 1973, and the pressure on costs and profits. Post oil shock and in the Reagan era, Union membership declined rapidly. Since the 1980s, an increasing share of income has gone to the top 10%.
|
Productivity -v- Wages 1947-2010
| 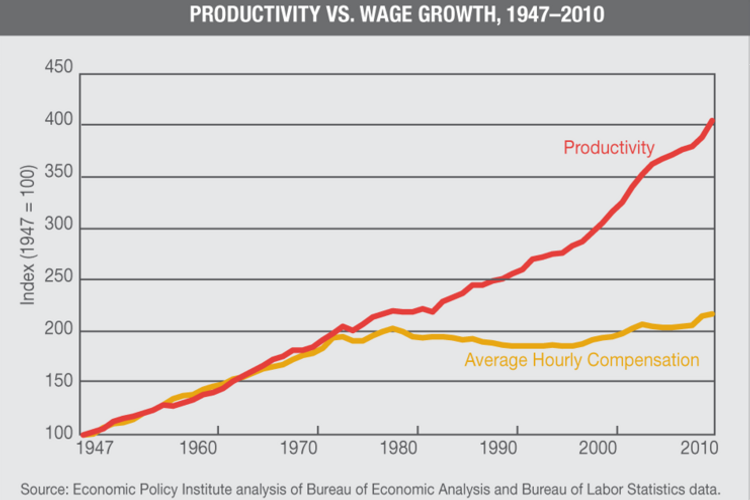
This shows the same relationship between productivity and wages. Academic economists and economists working at think-tanks and in government policy making positions have failed completely to get action to change this state of affairs, not for a short while, but essentially for 40 years! This is the sort of dysfunction that is very dangerous for the world. What is the point of doing the analysis, if nothing gets done to fix the problems identified.
|
|
International Comparison of Income Inequality
| 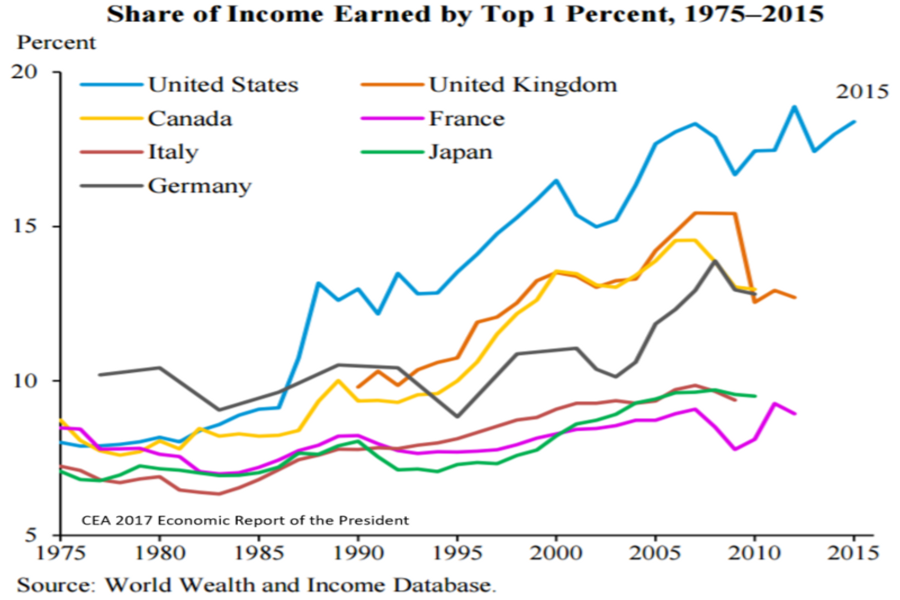
Share of income earned by top 1%, 1975 - 2015
| 40 years ago the concentration of income and wealth was similar in all major countries. Since the 1980s there has been substantially more concentration of income and wealth in the USA than in other countries.
|
US real wages flatline for more than 40 years
| 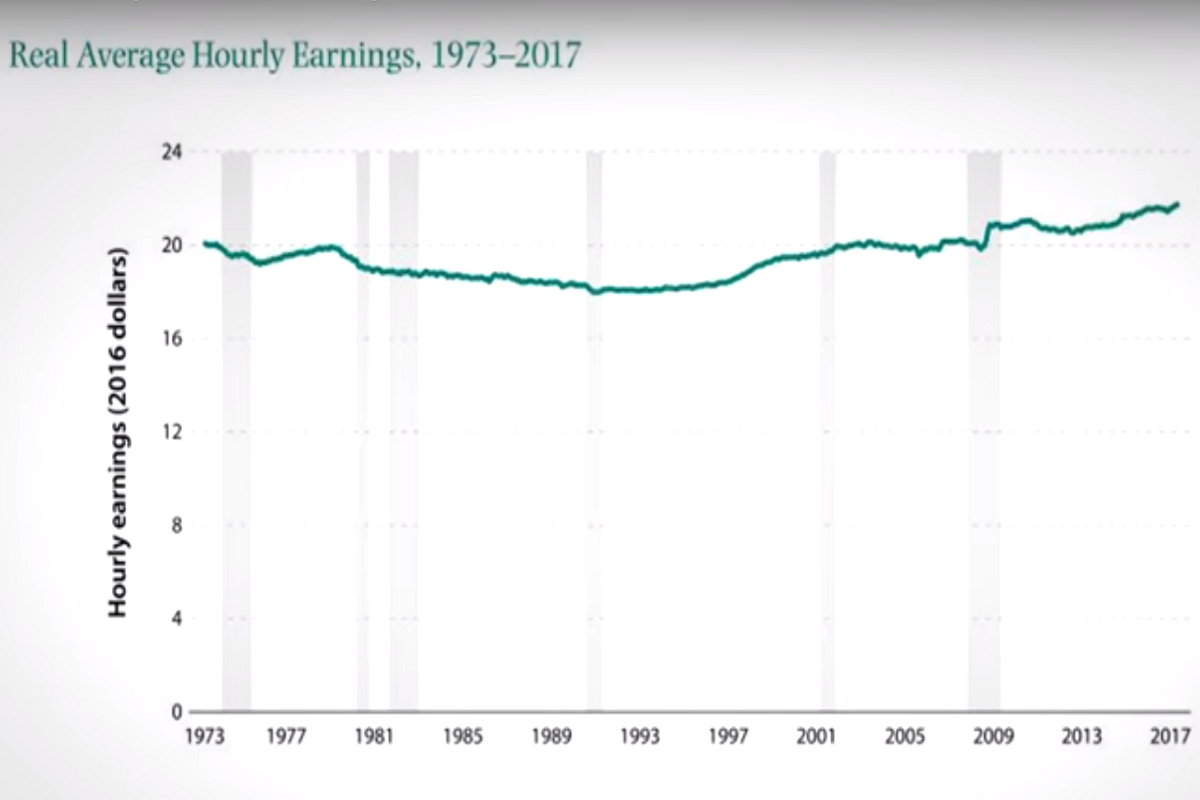
Wages from working have not improved significantly for a very long time ... but is far worse than this trend would suggest. This is an average. The 'average' is better than the reality for a very large number of people because, while there are many in the working community whose wages have indeed gone up, it is offset by many whose real wages have gone down. The reality is that the pain for those whose wages have gone down is larger than the joy for the people whose wages have gone up, something that thoughtless numbering tends to overlook!
|
|
INCOME INEQUALITY IN THE USA
| 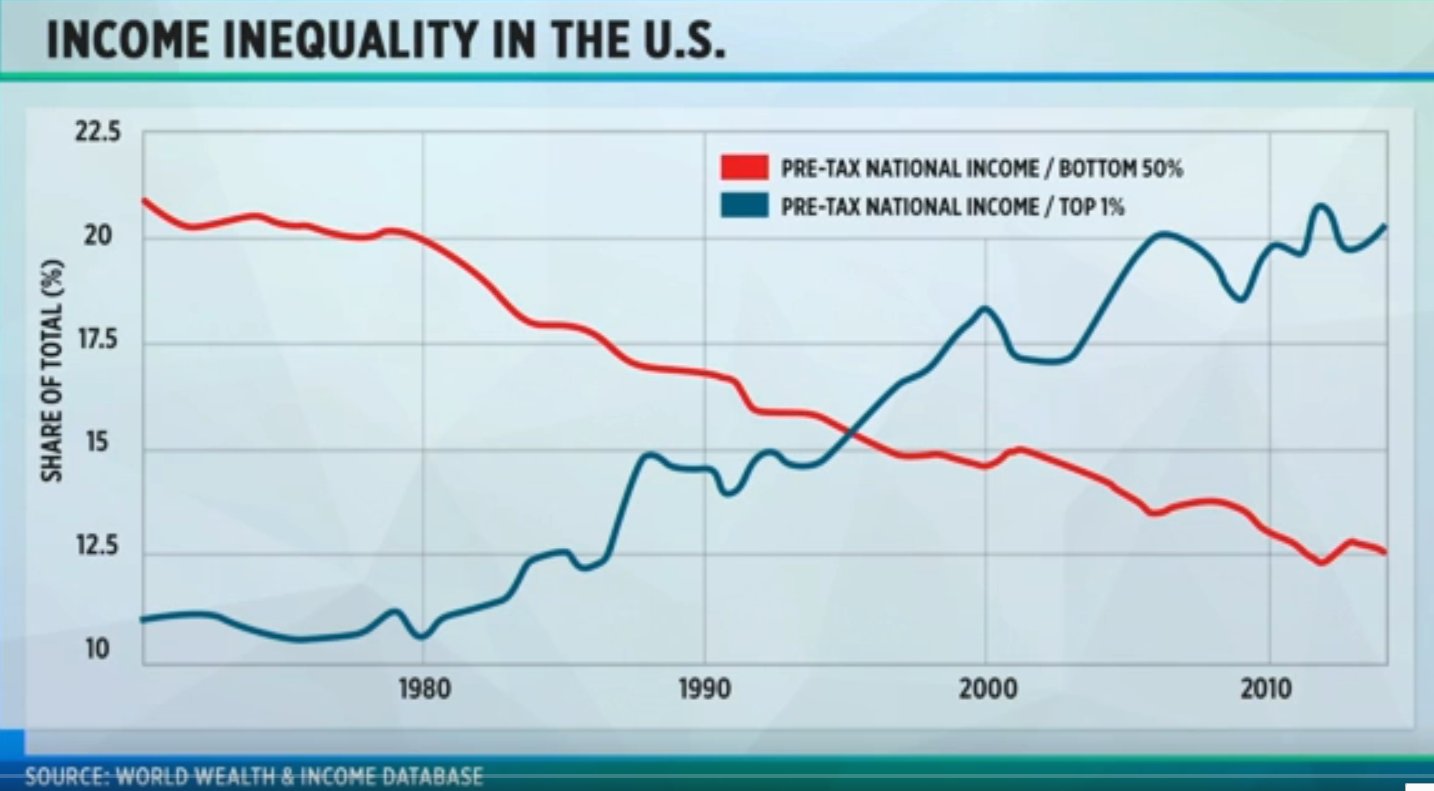
For the period from 1980 to 2015, the bottom 50% of the US population has shablack less and less of the total GDP while the top 50% has been increasing its share.
| This is a problem that emerged in the 1980s and has been getting worse and worse for going on 40 years!
Money the Dominant Goal ... and Metrics
|
| 
This is not funny!
| Money tips the scales no matter what the issue. But rather, it is reality! Business only invests in activities that have money profit potential. Some economists, investors and corporate managers argue that doing anything besides maximizing profit performance is 'ultra vires' ... an unfortunate idea promulgated by Milton Friedman, amongst others.
Austerity for the Poor ... not the Rich
|
| 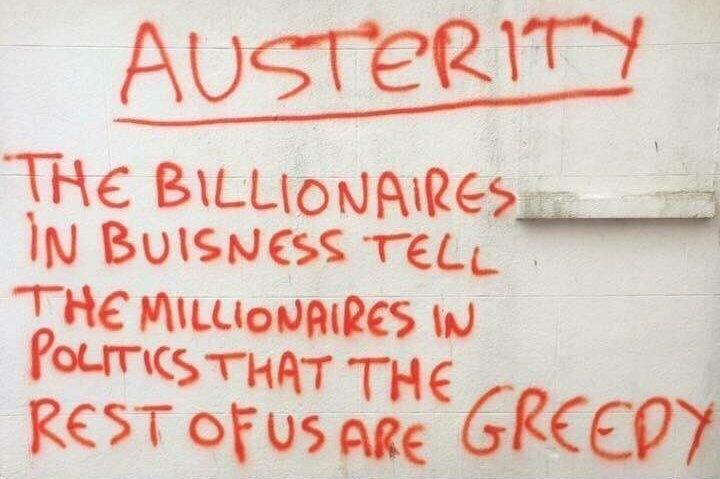
This may look sloppy ... but the content of this message is solid ... and it is a shame that those with power and influence don't do anything to address this issue.
| The fact that working people in the USA have been getting poorer and poorer for about four decades while millionaires have been becoming billionaires at a faster and faster rate is a national disgrace. | |||||||||
| L0300-Inequality-in-the-USA-01a | Open L0300-Inequality-in-the-USA-01a |
|
More about wealth inequality from Wikipedia
'https://en.wikipedia.org/wiki/Wealth_inequality_in_the_United_States' | Open external link |
| . |
| EXCESSIVE EXECUTIVE REMUNERATION | |
|
Executive Excess ... Money To Burn
A 32 page report of the Institute for Policy Studies (IPS) in 2015 |

| |

|
Key Findings
1. Insulated from the real costs of the climate degradation they help create, fossil fuel executives are enjoying stratospheric pay. 2. CEOs of the 30 largest U.S. publicly held oil, gas, and coal companies averaged $14.7 million in total 2014 compensation, over 9 percent more than the $13.5 million S&P 500 CEO average. 3. The top executives at ExxonMobil and ConocoPhillips each earned more than twice the S&P 500 average. 4. The management teams of America’s top 30 fossil fuel giants — the CEO, CFO, and next three highest-paid officers of each company (163 executives) — have together taken home nearly $6 billion over the past five years. MORE: Open PDF ... IPS-Executive-Excess-2015-Money-To-Burn |
| . |
| Pre-tax income growth in the United States | |
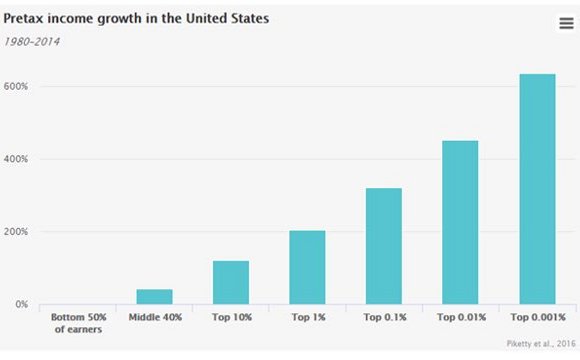
| The bottom 50% of wage earners in the United States have made no economic progress in more than 30 years ... since the Reagan administration ... and to a great extent because of the Reagan administration. At the very top, that is the top 1% or the top 10%, income growth has been spectacular ... while the 40% in the middle have seen improvement, but not really very much, and nothing like what was achieved in the previous generation or two. It should come as no surprise that there is a level of discontent in the USA (and in Europe) that is higher today than at any time since the Second World War. |
| Income Inequality Excessive in the USA | |
|
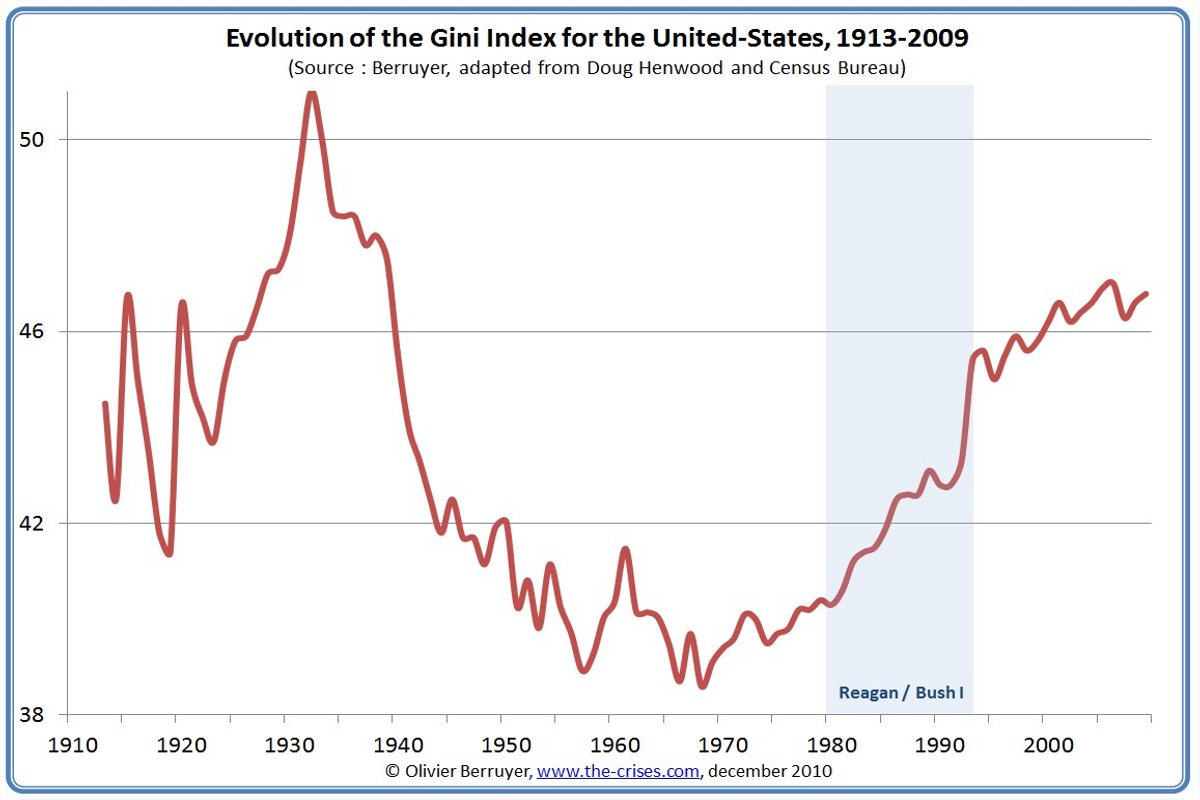
Inequality growing since around 1980
The Gini Index which measures inequality shows that the levels have been rising since the Reagan years and are now approaching the levels last seen in the 1920s prior to the stock market crash of 1920 and the subsequent depression. |
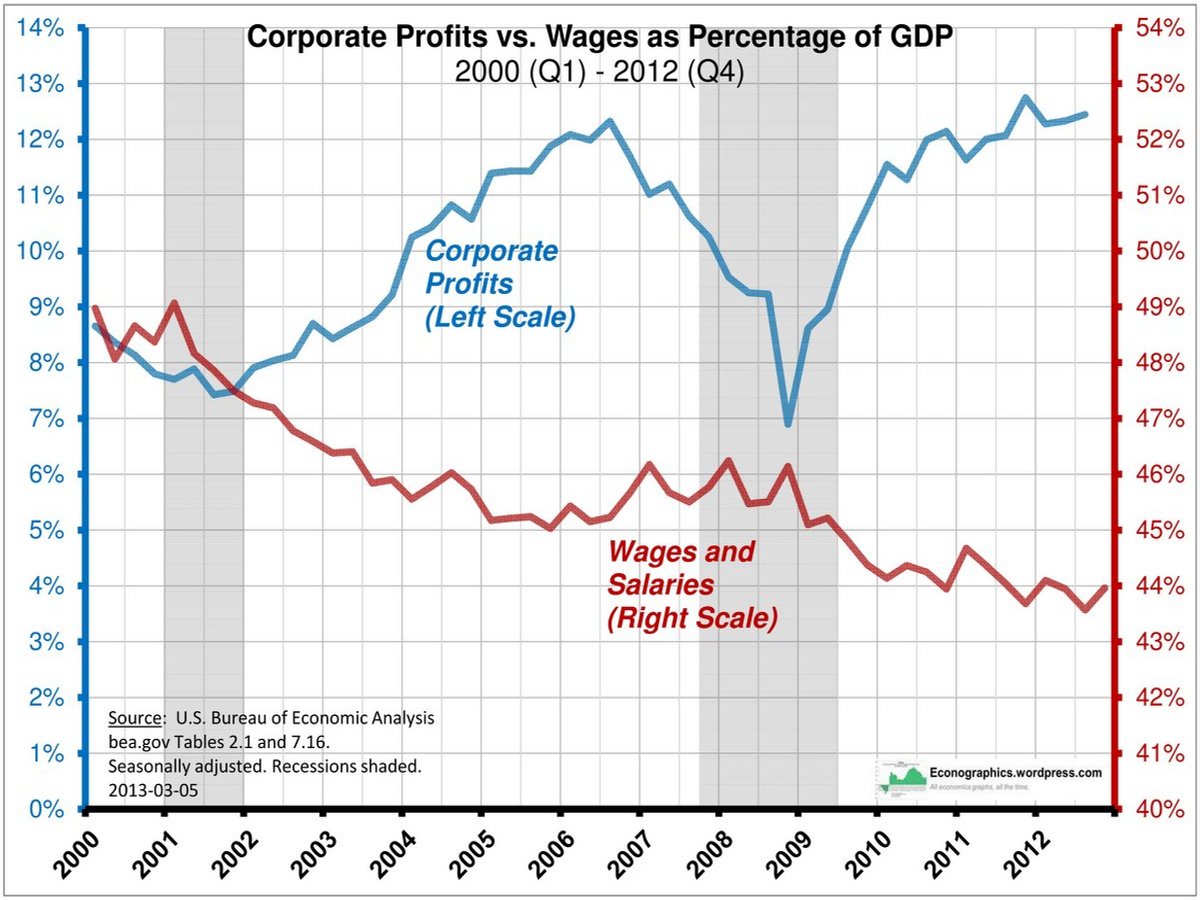
| Profits -v- Wages as a % of GDP | |
|
Corporate profits declined at the end of the Clinton administration. They recoveblack during Bush 43 until the banking crisis of 2008 and the great recession. Major initiatives by the Obama administration enabled an economic recovery and corporate profit recovery.
In contrast, wages deteriorated throughout the period of the Bush 43 administration and continued to deteriorate even as profits recoveblack during the Obama administration. A big part of the weakness of wage growth resulted from the posture of the Republican controlled Senate that was idealogically opposed to fiscal stimulus and the policy options that can be expected to improved wages. |
| Profits per job going up ... but not wages | |
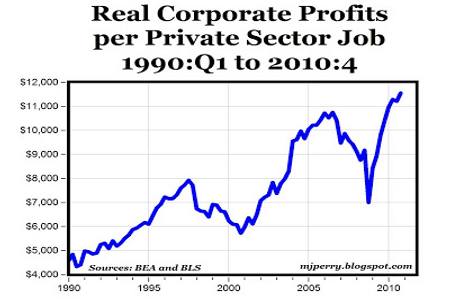
| The profits per job have been going up strongly since 1990, with some slippage just before and after 2000 asociated with the bursting of the dot.com bubble. Though management could have chosen to increase wages, they chose instead to keep wages as low as possible. At the same time rewards to executive management and stockholders increased. |
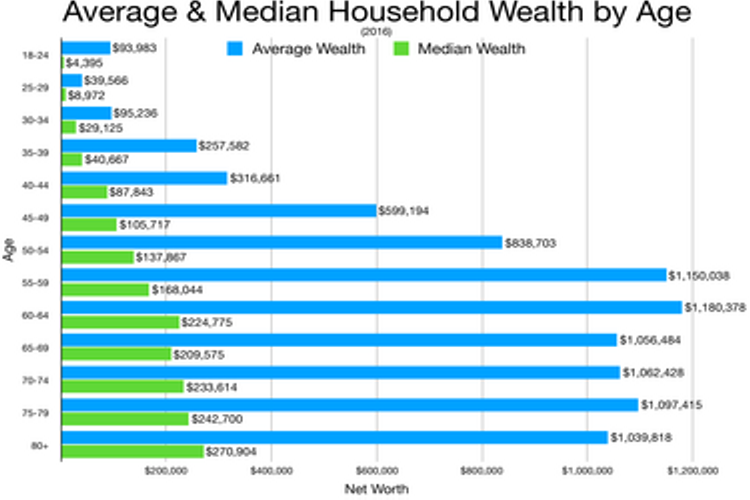
| Average (Mean) looks good ... but Median not much | |
|
What is the message?
This bar-graph shows the amazing difference between the Mean and the Median, but this difference is not in he news. The mean suggests that older people have grown their wealth considerably, while the median shows that most people have rather little increased wealth as they age. MORE: Open L0900-IS-Inequality-in-the-USA-01a |
| . |
| INTRANGIDENT POVERTY | |
| POVERTY IN A WEALTHY WORLD | |

| If we live in a rich, prosperous world, how come there are places like this? |
| MORE POVERTY IN A WEALTHY WORLD | |

| This is in a village in Africa |
| . |
| OBSCENE OWNERSHIP WEALTH | |
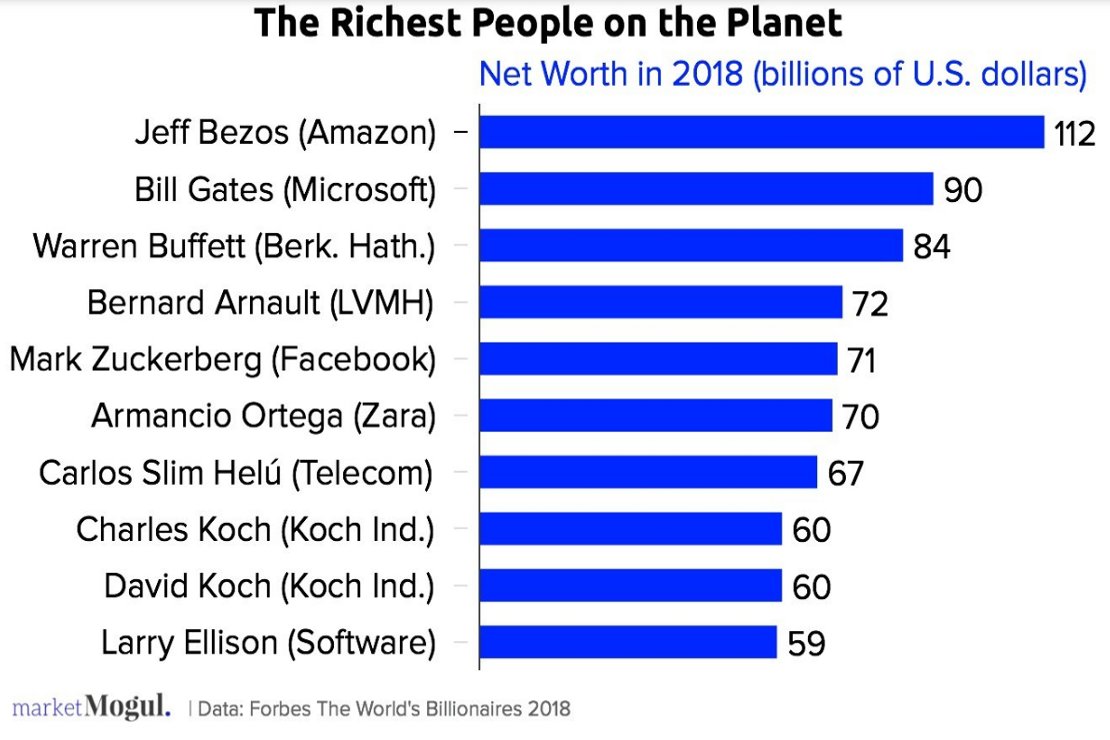
| Some of the Wealthiest Individuals | |
|
All of these men became fabulously rich because they owned all or a big part of companies that grew to dominate in their industry.
Many of these men now own very large investment porfolios, and increase their wealth year over year as long as the portfolio increases in value. Capital markets have increased substantially in value since 1980, while wages in industrialized countries have increased very little. There is little information available about the impact the porfolios of these wealthy people are having on social capital and natural capital. Most 'family offices' have a singular focus on the value increase of the portfolio and do not give much, if any, weight to social impact or environmental impact. |
| Toys for the Ultra Rich | |

| Wasted wealth! In the decades since the 1980s there has been an amazing growth in the number of ultra wealthy people ... as evidenced by the impressive toys that this community of folk are able to own. |

|
A view of the harbor in Monaco
Creating wealth is one thing ... concentrating the ownership of wealth is a very different thing. Very few people understand the difference between thse two things, and it is not by accident. |
| Affluence in close proximity to poverty | |

|
This is in Brazil ... I think Sao Paulo
|

|
This is Kenya ... I think Nairobi
In some ways the problem of inequality is accentuated because there is great affluence in close proximity to poverty. The poor are easily able to observe how the top of society is living and compare it to their own situation ... and it is not comforting. These scenes are replicated in almost every major city in the world. There are some good things associated with the growth of major urban cities, but the growth of slums is not one of them. |
| . |
|
|