
OVERVIEW
MANAGEMENT
PERFORMANCE
POSSIBILITIES
CAPITALS
ACTIVITIES
ACTORS
BURGESS
|
CARBON POLLUTION
HIGH CARBON COMPANIES And the countries where they are located. No information howeever on how things are changing. 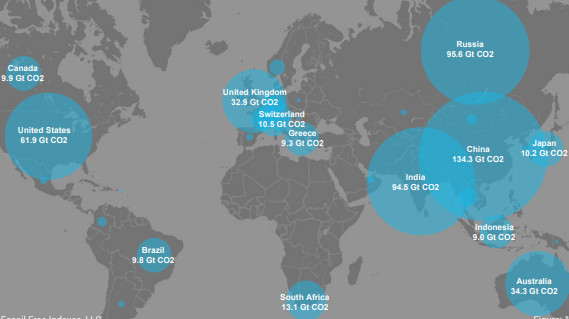
Top Countries Mapped by Company Headquarters 2014 Total Coal, Gas, and Oil Reserve Emissions Potential (GT CO2) Image from: ../Carbon/FFI-200-Companies-of-the-Carbon-Underground-2014.pdf Peter Burgess COMMENTARY There is important information in this map. The problem of carbon emissions is a very big and global. This map describes the situation at a point in time ... specifically 2010. Everything is moving and while the USA is expanding rather slowly, many other countries are expanding at a fast and accelerating rate ... most importantly China and India. From a management point of view, this map is useful. Peter Burgess | ||
|
| The text being discussed is available at | and |