U.S. Inflation: How Much Have Prices Increased?
Published on December 30, 2022
By Avery Koop
u.s. inflation by goods infographic
▼ Use This Visualization
U.S. Inflation: How Much Have Prices Increased?
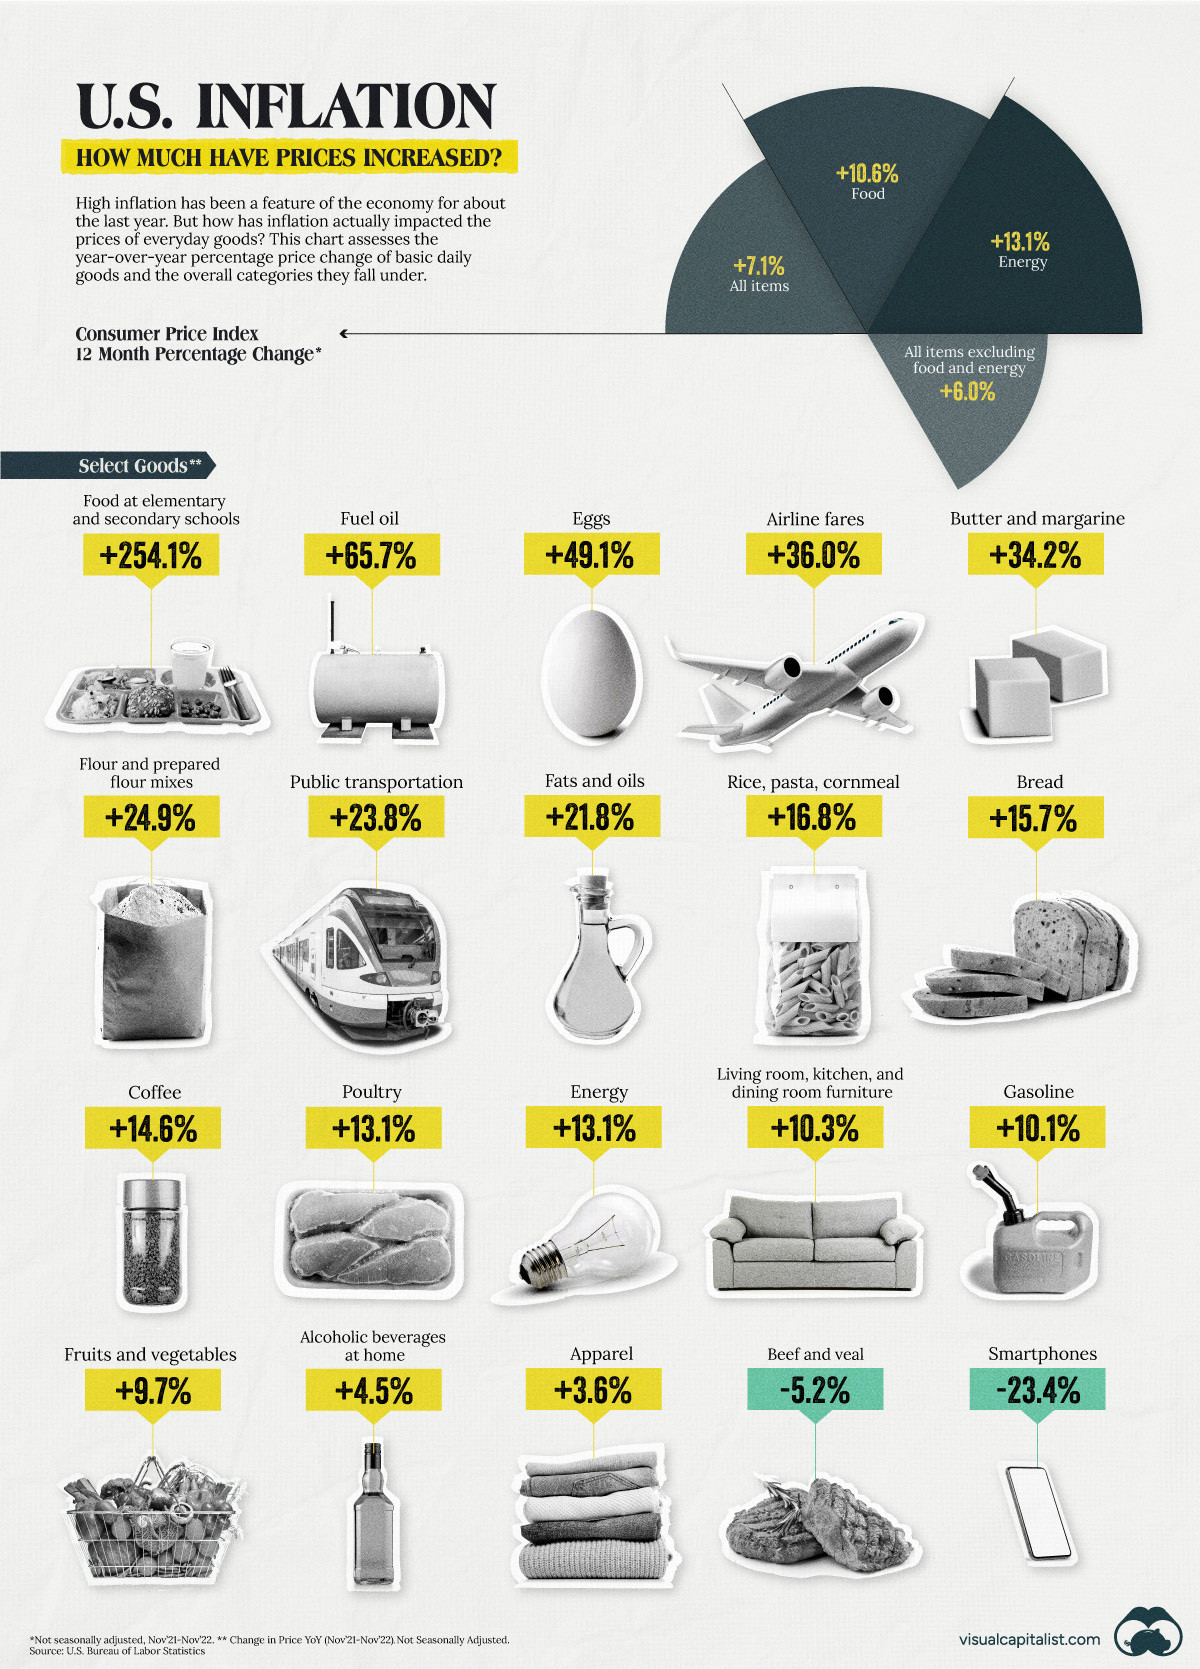
Inflation has been top of mind over the last year, looming over every aspect of the economy. But how has inflation actually impacted the prices of everyday goods like bread and butter or gas and public transportation?
In this visual, we showcase select items and how inflation has impacted the price year-over-year. Additionally, we’ve charted the overall price increases across the overarching goods categories, using data from the U.S. Bureau of Labor Statistics (BLS).
Note: These numbers are assessed using the Consumer Price Index (CPI) for all Urban Consumers (CPI-U), using the U. S. city average by detailed expenditure category.
How Much has the Cost of Goods Gone Up?
All items +7.1%
Inflation has caused the cost of many goods to increase significantly compared to last year. The most dramatically affected item is elementary school lunches, a cost in the U.S. that is already unaffordable for many families.
Here’s a look at every single reported good’s change in price from last year:
Search:
Item Unadjusted Change YoY (Nov 2021 - Nov 2022)
- Food at elementary and secondary schools +254.1%
- Food at employee sites and schools +110.1%
- Fuel oil +65.7%
- Eggs +49.1%
- Margarine +47.4%
- Other motor fuels +43.3%
- Fuel oil and other fuels +41.7%
- Airline fares +36.0%
- Butter and margarine +34.2%
- Butter +27.0%
Showing 1 to 10 of 337 entries
School lunches became more expensive this year as a federal waiver program came to an end. The program had provided every school child in the country with free lunches.
After school lunches, fuel oil and eggs rank high in terms of big jumps in their prices, increasing by 66% and 49% respectively. Some other notable increases: airfares have gone up by 36%, living room, kitchen, and dining room furniture by 10.3%, and alcoholic beverages at home by 4.5%.
However, a number of goods have actually gone down in the index, including:
Smartphones: -23%
Televisions: -17%
Uncooked beef roasts: -8%
Admission to sporting events: -7%
Car and truck rentals: -6%
Interestingly, smartphones are not actually getting cheaper, rather the BLS adjusts for products that improve rapidly in quality year-over-year. Usually, most items are identical on a year-to-year basis, but smartphones are improving in their quality, which is why their price appears to be deflating rather than inflating.
U.S. Inflation
Overall, the items in the basket of goods under the Consumer Price Index have increased by a collective 7.1% since last year, making purchasing necessary food and energy items more difficult.
Here’s another look at how each overarching category increased, between November 2021 and November 2022:
Food: +10.6%
Energy: +13.1%
All other items excluding food and energy: +6.0%
Purchasing your everyday ingredients to cook with, energy to heat your home, and all other items that are standard in our everyday lives has become increasingly expensive. In an effort to counter inflation pressures, the U.S. Federal Reserve has been raising interest rates to make borrowing more difficult in order to push down demand.
Heading into 2023, many feel that a recession is on the way, and a lot of households will have to continue borrowing at higher rates to keep up with basic goods purchases. On the upside, some experts anticipate that although there will be economic downturn, it will be brief and won’t deeply impact the economy like past ones.
| The text being discussed is available at
and
| |