
OVERVIEW
MANAGEMENT
PERFORMANCE
POSSIBILITIES
CAPITALS
ACTIVITIES
ACTORS
BURGESS
|
US STOCK MARKETS
MASSIVE SELL0FF Raging Markets Selloff in Five Charts: $36 Trillion and Counting 
Summers Sees 'Tremors' of August 2007 Anxiety in Markets Original article: https://www.bloomberg.com/news/articles/2022-10-01/raging-markets-selloff-in-five-charts-36-trillion-and-counting Peter Burgess COMMENTARY The drop in stock market prices is causing concern for a lot of rich investors, but really should not come as a surporise. I have been of the view that 'financialization' of the modern economy has meant that investors have been able to benefit from the improved productivity of the economy much more than everyone else. This financialization has been in play for more than 40 years and has done serious damage to US society where a majority of the population ... maybe as much as 80% ... have lost household wealth during this time. Whether or not the losses being described in this Bloomberg analysis are real or are simply market value changes with no true tangible meaning is not clear ... if a market valuation changes in a positive direction and then later changes in a negative direction, has anything of economic importance actually happened. In most 'market moves' this is all that is happening. Quality of life ... that is real tangible quality of life and cost of living ... does not change like a stock market. Enough decent food and enough decent housing is real ... and thse need to be available and affordable. Considering the aggregate wealth of the United States, it is appalling that so many people are not living at this basic standard. The fiscal and monetary tools at the disposal of the Government and the Federal Reserve are powerful but blunt ... and likely to do as much damage as they do good. The question is who will get to bear the damage and who will get the benefit of the good, and is is likely that the impact of almost any policy action will deliver benefit for some group and will do damage for another group. Over the course of history, almost all the policy action implemented by these authorities have served to protect wealth and done it at the expense of those with little wealth and financial security. It ought not to be this way ... and the fact that it is this way is a great disappointment. By this time in history we should be able to do a lot better. Peter Burgess | ||
|
Raging Markets Selloff in Five Charts: $36 Trillion and Counting
Written by Jan-Patrick Barnert ... @JPBarnert October 1, 2022 at 2:00 AM EDT Whether super-safe US Treasuries or the riskiest emerging equities, global stocks and bonds have lost a record $36 trillion in value over the past nine months in a wild selloff that engulfed assets right across the risk spectrum. With the year heading into its last quarter, there is likely more pain ahead. Central banks are in full fire-fighting mode, making clear they intend to raise interest rates further to douse inflation, even if that leads to economic recession. From the look of it, one could be forgiven for stashing cash under the mattress. Indeed, in the latest Bank of America Corp.’s fund manager survey, participants said their exposure to cash was at all-time highs. And for markets that started the year with valuations at multi-year, or even record highs, the liquidity pullback has been pretty much like pressing a reset button. “We are seeing the world being remade politically and economically, with the trends beginning now set to last for the rest of the decade,” says David Dowsett, global head of investments at GAM Investment. “We are experiencing what is known in German as a ‘Zeitenwende,’ an epochal shift.” Here are five charts showing the damage to global financial markets this year, offering hints for rest of the year: The Big Dent 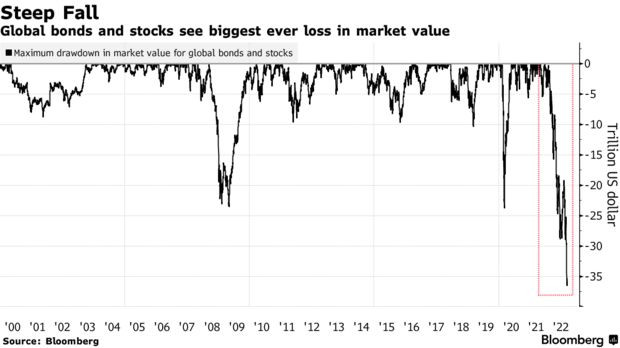
Global bonds and stocks see biggest ever loss in market value This year’s pullback outpaces steep declines seen during the 2008-2009 financial crisis and the 2020 pandemic, based on the drop in market value of the Bloomberg GlobalAgg Index and the MSCI All-Country World Stocks Index combined. Perhaps this is not surprising given the tidal wave of cash that flooded into world markets during the easy years. But the pace of this year’s value destruction is still alarming: the $36 trillion shaved off markets in nine months had been amassed over roughly double that time, between mid-2020 and late-2021. Not Easy Anymore 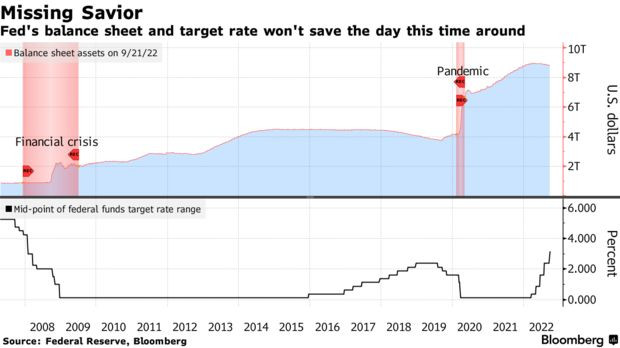
Fed's balance sheet and target rate won't save the day this time around Ultra-easy monetary policy was the cornerstone of the longest-ever equity bull market, that was only briefly interrupted in 2020 by Covid. Now the US Federal Reserve and its peers are knocking down what they helped build. Strategists at BofA have counted 294 interest rate hikes globally since August 2021 alongside $3.1 trillion in “quantitative tightening” in the past seven months. As a result, the “global stock and bond market cap has cold-turkey collapsed,” they wrote on Friday, adding that the rates and quantitative tightening shock had hit Wall Street’s “addiction” to liquidity. Volmaggedon
Volatility measures have risen in all major asset classes Gauges of currency and bond volatility have been a leading indicator of the ongoing rout. They have been elevated most of this year, with the ICE BofA Treasury volatility index approaching levels hit when the pandemic erupted in 2020. However, the CBOE Volatility Index, known as Wall Street’s fear gauge, remains below levels seen during past bear markets. Given it has room to rise, some investors are concerned. Goldman Sachs Group Inc. and BlackRock Inc. are among those warning that markets are yet to price in the risk of a global recession. Nowhere to Hide
Traditional safe heavens such as bonds and gold also fell this quarter ... Source: Bloomberg It’s been one of those rare years when bonds and stocks have sold off simultaneously. After all, inflation is at multi-decade highs, forcing central banks to act aggressively. Rising borrowing costs, high oil prices and the war in Ukraine meanwhile cloud the outlook for economic growth and company earnings. All that has put the S&P 500 Index and the Nasdaq 100 Index on track for their third consecutive quarter in the red, their longest losing streak since the global financial crisis and the bursting of the dot-com bubble, respectively. As for alternatives: Treasuries and gold are the two traditional safe heavens but they have lost even more than stocks this quarter. Bitcoin and the dollar are the only assets offering positive returns. A Quarter to Forget First Time in Decades S&P 500 Index never closed negative after strong gains since 1938
Source: Bloomberg The third quarter will also get its place in the history books for one of the biggest reversals: It is the first quarter since 1938 that the S&P 500 Index closed in the red after gaining more than 10%. All in all, 2022 is the year that reflects a “painful regime change,” said Michael Hartnett, BofA’s chief investment strategist.
| The text being discussed is available at | https://www.bloomberg.com/news/articles/2022-10-01/raging-markets-selloff-in-five-charts-36-trillion-and-counting and |