
OVERVIEW
MANAGEMENT
PERFORMANCE
POSSIBILITIES
CAPITALS
ACTIVITIES
ACTORS
BURGESS
|
PROFIT MARGIN
CORPORATE MARKUPS Roosevelt Institute ... Prices, Profits, and Power: An Analysis of 2021 Firm-Level Markups 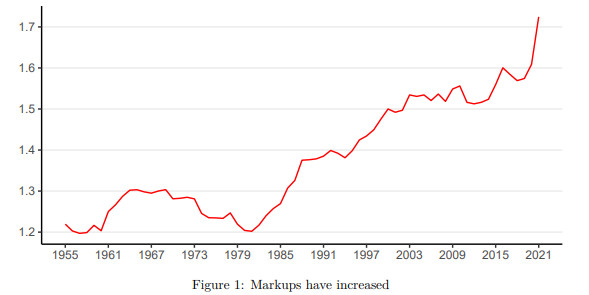
Corporate Markup % from 1955 to 2021 ... Sales have increased more than costs ... Profit margins are at record highs Local PDF: RI-202206-Prices-Profits-Power-23032.pdf Original PDF: RI_PricesProfitsPower_202206.pdf Peter Burgess COMMENTARY My understanding of inflation and the underlying corporate behavior is supported 100% by this paper recently prepared by the Roosevelt Institute. During my early career I went through an industrial Management Training Program (with the Davy Ashmore engineering group), did Articles in Chartered Accountancy (with Cooper Brothers $ Co.) and studied informally with the Institute of Cost and Works Accountants. From the early days of my career I became familiar with the behavior of costs, the behavior of revenues and the resultant behavior of profits. I stress the idea of 'behavior' because while much corporate behavior is depicted as straight lines and single points, in the real world the interaction of several bahaviors is both complicated and significant. Some of the time series graphs in this report ring true, but I am a little surprised at the graphical presentation of data from the 1970s. My experience from that time (when I was a young CFO in the industrial sector) was that for many companies margins went negative. This is why the inflation of the period was described as 'cost push' inflation because many companies had to put up prices in order to survive. I did not see reference to 'price elasticity' in the following paper. In the 1970s this was an important factor and the structure of industry in the United States went into shock and changed. Several major industries in the United States went into terminal declines because they were very energy inefficient after decades of very low energy prices and their products could be imported at substantially lower cost. Cement is one example. In Europe, for example, though the price of crude oil was determined in a world-wide market, there were substantial taxes imposed by the European governments on energy use and accordingly the use of energy was minimised througout industry and the economy ... as, for example, with fuel efficient (compared to the USA) cars and trucks. The current US 'inflation' is massively unlike the inflation of the 1970s. In the 1970s the inflation was 'cost push' while now the base costs in most products are at record low levels, but the embedded profits are at record levels. The idea of 'embedded profits' is important, because over time the 'supply chain' for most products has been optimized with most products flowing through many processes and companies before final sale and use by the end customer. Companies understand this dynamic, but it is not easy to see as an outsider ... and I am not aware of good data on the subject (though this may be because of my age and being out-of-touch!). Bottom line, however, is that this is a very important contribution to the current discussion about the nature and specifically the root-cause of the inflation now being experienced in the USA and around the world. It should be required reading for anyone in the media who writes (talks) about inflation. Peter Burgess | ||
|
Prices, Profits, and Power: An Analysis of 2021 Firm-Level Markups
Written by Mike Konczal and Niko Lusiani from the Roosevelt Institute Mike Konczal is the Director of the Roosevelt Institute’s Macroeconomic Analysis team. Niko Lusiani is the Director of the Roosevelt Institute’s Corporate Power team. Special thanks to:
Abstract How to understand and respond to inflation has become one of the central debates of this economic recovery. This research brief is the first to explore the size and distribution of markups (essentially the difference between sales and marginal costs) and profit margins across 3,698 firms operating in the US in 2021. Reproducing and updating the analysis of Jan De Loecker, Jan Eeckhout, and Gabriel Unger’s The Rise of Market Power and the Macroeconomic Implications, we find that markups and profits skyrocketed in 2021 to their highest recorded level since the 1950s. Further, firms in the US increased their markups and profits in 2021 at the fastest annual pace since 1955. Digging deeper, the evidence of this unusually and suddenly high jump in markups fits all three of the main explanatory stories of inflation being debated—namely those related to changes in demand, supply, and market power. First, we see broad markup increases across many types and sizes of firms, suggesting a demand side of the story. Second, the data points to a historically unique movement of markups between industries in 2021, suggesting a supply story. Lastly, we find that, adjusting for size, pre-pandemic markups are a strong predictor of the increase in markups during 2021, suggesting a role for market power as an explanatory driver of inflation. More specifically, a 10 percent higher level of size-adjusted markups before the pandemic is associated with an increase between 1.6 and 2.7 percent in 2021. Since markups are unusually and suddenly so high, there is room for reversing them with little economic harm and likely societal benefit, including lower prices in the short term, and less inequality and potentially more innovation in the medium term. We believe the evidence presented in this brief points to an all-of-government administrative, regulatory, and legislative approach to tackling inflation that includes demand, supply, and market power interventions. Introduction 1 Inflation has quickly become the front-of-mind economic concern for many American households (Doherty and Gómez 2022). Lower-income households and communities of color, who spend a greater proportion of their budgets on basic necessities like rent, gas, and food, are disproportionately burdened by rising prices. For these families, their qualities of life and investments in their futures suffer as a result. So, why are prices rising? The answers policymakers and the public have to this question condition how we respond as a nation to the challenge of rising prices, with lasting economic consequences for households across the country. Inflation was significantly higher than forecasters predicted throughout 2021 and has remained so in 2022. The Personal Consumption Expenditures (PCE) Price Index, which the Federal Reserve uses to monitor its 2 percent average flexible inflation target, was nearly 6 percent during 2021. Researchers have proposed and debated three explanations for why inflation has been so high, which we loosely term demand, supply, and market power. The distinction between these three explanations is not just an academic debate; distinguishing between them is crucial to understanding the causes and solutions to increasing prices. US policymakers put a significant amount of fiscal and monetary stimulus behind the recovery, especially through the 2021 American Rescue Plan. Proponents of the demand argument say that this stimulus has pushed demand too high, resulting in inflation (Furman 2021). Proponents point to the higher levels of inflation and personal disposable income as compared to European countries (Jordà et al. 2022), the excessive savings built up during the pandemic, and high values of labor market indicators such as job openings and quits (Domash and Summers 2022). Proponents of the supply explanation point to the disproportionate increase in spending on goods over services during the recovery, and the pressures that this has put on supply chains, which have suffered from decades of disinvestment. Investment choices by firms during the pandemic, especially around automobiles and semiconductors, have also affected reopening, and both the pandemic itself and broader geopolitical crises continue to pressure the supply side (Bernstein and Tedeschi 2021). Observers have also cited long-standing disinvestment and financialization of critical supply chains as setting the stage for pandemic shortages (Dayen and Mabud 2022). Beyond these developments, proponents point toward the lack of either a wage-price spiral in worker wages or an increase in the labor share of income as evidence that demand is not the core driver of inflation (Bivens 2022b). A third explanation argues that market power has been a driver of overall price increases, as the interaction of demand and supply changes have given firms, especially dominant ones, more power and discretion to set upward pricing strategies during the shifting demand and supply dynamics of the recovery. The more concentrated the economy is, the more ability the dominant firms have to turn pandemics shocks into higher prices (Bräuning, Fillat, and Joaquim 2022). In the tax incidence literature, which analyzes who ultimately bears cost increases between firms and consumers, the idea of “over-shifting,” or a pass-through rate of over 100 percent for costs, is both present in the latest models and seen in the empirical evidence. Under either monopoly or oligopoly, pass-through can exceed 100 percent if demand is very convex (Weyl and Fabinger 2013), and this has been observed in markets for solar panel leasing (Pless and Benthem 2019), alcohol taxes (Kenkel 2005), cigarette taxes (Delipalla and O’Donnell 2001), and more broadly across sales taxes (Besley and Rosen 1999). The idea that some costs on firms could be over-shifted to consumers in a concentrated economy is worth taking seriously. In this understanding, financial analysts and shareholders expecting short-term earnings boosts from increasing prices over and above the costs (i.e., markups) encourage firms to be price-makers instead of price-takers, and similarly punish firms that don’t exhibit or exert pricing power (Mabud 2022). The evidentiary focus here has generally been on economy-wide national accounts measures of profits and profit margins, as well as analysis from presentations of price increases on earnings calls (Owens 2022). These three factors—demand, supply, and market power—interact and reinforce one another in the real world. However, thought leaders and policymakers often focus solely on the specific tools to curb their preferred driver of inflation. But whatever the sources of inflation, the validity and size of the observed profit margins and price markups matter significantly for how we respond going forward. If margins are unusually high, then there’s the possibility that profits and markups can decrease as either supply opens up or demand cools, removing pricing pressure. Such a high profit margin also means that there’s room for wages to increase without necessarily raising prices—an important dynamic in a hot labor market. Markups also matter more generally for the economy because they distribute economic gains from consumers and workers to firms and shareholders, especially when almost 100 per cent of publicly traded firms’ earnings are distributed upward to shareholders rather than retained and reinvested in the company itself (Palladino and Lazonick 2021). Markups have also been found to change consumers’ decisions, increase economic rents, and distort incentives for investment and innovation over time (Harberger 1954; Döpper et al. 2022). It’s unclear whether or not these dynamics will happen. But it’s important to first understand empirically whether and how margins and profits have actually increased during this recovery. Data and Methodology This analysis replicates the methodology and analysis of markups and profits from The Rise of Market Power and the Macroeconomic Implications by Jan De Loecker, Jan Eeckhout, and Gabriel Unger (De Loecker, Eeckhout, and Unger 2020), in which the authors estimated that markups—how firms price and sell goods and services above marginal costs—had been flat from 1955 through 1980 but increased in a consistent and dramatic fashion through 2015 (the last year in their sample). This increase was almost entirely driven by firms in the top half of the markup distribution, and especially the top quarter. In addition, profitability increased for these firms, even controlling for changes in overhead costs and other business measures. In this brief, we update their analysis through 2021. We rely on data from the real-world financial accounts of firms for the period 1955–2021, as collected by Compustat. Compustat pulls its information directly from a variety of sources including the Securities and Exchange Commission (SEC) filings of the companies themselves, company annual and quarterly reports to shareholders, and S&P’s Global Indices. This gives us an initial 586,504 firm-level observations, with 11,490 from firms in 2021. Though comprehensive when it comes to publicly traded firms, this data may not be fully representative of the US economy. As (De Loecker, Eeckhout, and Unger 2020) notes, publicly traded firms tend to be slightly older, larger, and more capital- and skill-intensive than the economy as a whole, and the industry mix differs from that of the larger universe of US firms. Moreover, we are unable to create concentration ratios with this data, as the results would differ from more comprehensive data (Keil 2017). Further, all 2021 firms may not have reported at the time this research was conducted; as of June 6th, 2022, we were looking at an initial 11,490 firms in 2021 versus an average of 12,293 firms from 2019–2020. The addition of several thousand 2021 data entries to this analysis over the course of the research hasn’t changed the results, so it is unlikely there is a bias introduced from this earlier analysis. In order to clean the data, we removed firms with multiple observations in a year, with missing NAICS codes, and with missing or zero sales, cost of goods sold (cogs), or NAICS information. We filtered out the top and bottom 1 percent of the ratio of sales to cogs and repeated this for cogs as a share of cost of capital. We deflated income data by PCE. The result is 3,698 observations for 2021 and 265,893 observations between 1955 and 2020. (De Loecker, Eeckhout, and Unger 2020) finds that a markup of a firm can be derived from the following equation: 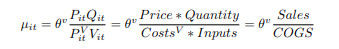
Where θ v is an industry- and year-specific production function, PitQit is total revenue, which can be approximated by sales, and P V it Vit is average cost of production multiplied by production, which can be approximated by cost of goods sold. Both of these are reported by the firms in the income statement that Compustat collects and standardizes across years and firms. Because of data limitations, we did not estimate the production function for 2021 in the markup equation. Instead, we used 0.85, the average value in their sample, across firms and years. We checked this by using industry-level production functions for 2015 for subsequent years and found the significance and general results unchanged. Throughout this analysis, we used both firm-level markups and size-adjusted firm-level markups. In order to adjust for size, we weighted the firm by the share of total sales in that year. This is important because the size of sales of firms varies greatly among our sample. Looking at yearly sales averages, the 75th percentile of firms has 22 times the sales of the 25th percentile, while the 90th percentile firm has over 400 times the sales of the 10th percentile. The more sales a particular firm makes, the more impact it will have on consumers, prices, and the economy as a whole. For firm-level regressions, we used prior-period markups as a proxy for market power. Some authors have used concentration ratios in this context; however, we cannot create reliable concentration ratios given the limitations of this data. Even if this data was available, we believe that properly tracking market power should go beyond how concentrated a market is to include underlying market imperfections and power imbalances between stakeholders in the firm (Manning 2003; Naidu and Posner 2020). Markup indicators are able to grasp these dynamics. Empirical Questions and (Some) Answers Are markups up or down? The following four figures largely reproduce the methodology in (De Loecker, Eeckhout, and Unger 2020). In order to look at how firms have increased their markups in the aggregate, we added up size-adjusted firm-level markups from 1955 through 2021. The results are shown in Figure 1. We found that markups in the year 2021 were both the highest level on record and the largest one-year increase—over 2.5 times the increase of the next several largest annual increases. While markups averaged 1.26 between 1960 and 1980, they have been on a slow and consistent rise since then, averaging 1.56 during the 2010s. In 2021, markups suddenly increased to 1.72—that is, the average markup charged in 2021 was 72 percent above marginal cost. In other words, in 2021, we see a sharp increase in the 30-year trend of firms in the aggregate decoupling their prices from their underlying costs.
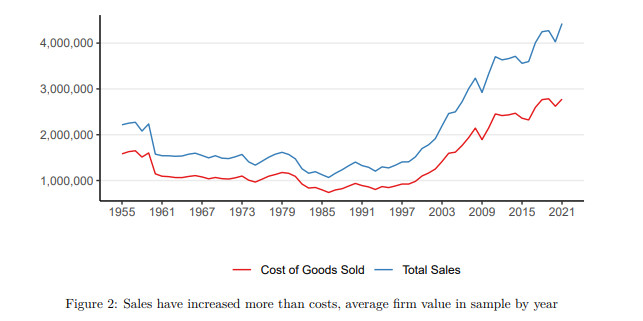
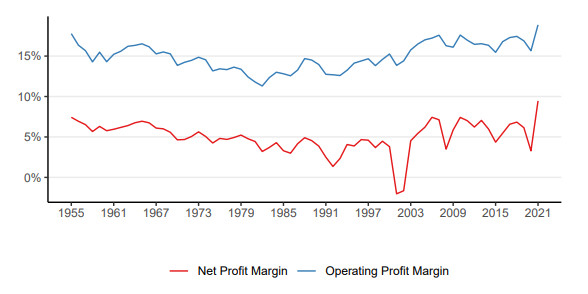
Corporate Markup % from 1955 to 2021 Breaking this down into its constituent parts, we can look at aggregate sales and aggregate cost of goods sold separately in each year since 1955. Figure 2 shows the evolution of both of these, taken as the average values across firms in each year. We find that 2021 was largely driven by increased sales, with costs (including wages) increasing only slightly. This is inconsistent with any indication of a wage-price spiral. Are profits up or down? Higher markups do not necessarily have to translate to higher profits, but they did in 2021. Figure 3 shows two definitions of annual profits across the data set from 1955 to 2021. Operating profit margin here is defined as sales minus costs of goods sold as well as selling, general, and administrative expenses (sga) as a percent of sales. This definition is pretax, and thus won’t be driven by the Tax Cuts and Jobs Act (TCJA). We see it going from 14.6 percent from the 1960s through the 1980s to 16.7 percent during the 2010s. It then jumps to 19 percent in 2021. The 3.2 percent annual increase to that level is more than twice the next highest annual increase across the time period analyzed. This is noteworthy, as there’s considerable debate in the literature over whether, and by how much, to include sga as part of the costs for determining the markup. Our analysis found that, even when sga was included in the costs of production for markups, as it is for operating profits, we still got the same results. We also looked at net profit margin, here defined as net income divided by sales. Net income is defined as profits after taxes, in addition to other costs. Here we see a more consistent range, with net profit margins increasing from a yearly average of 5.5 percent from 1960 to 1980 to averaging 6 percent during the 2010s. In 2021 it jumped to 9.5 percent—again its highest value on record. Profits were consistently up across definitions.
Figure 2: Sales have increased more than costs, average firm value in sample by year
Figure 3: Profit margins are at record highs How has the distribution of markups between firms changed? We next turned to the distribution of markups between firms. As a result of creating firm-level markups, we were able to calculate the distribution of markups between firms, as well as observe changes both over time and in 2021. Figure 4 shows the distribution of markups between firms by year. De Loecker, Eeckhout, and Unger (2020) emphasized that markups were increasing only in the top half of the distribution over the past four decades. This means that markups have largely been driven by the very top of this distribution—around the 75th and especially the 90th percentile. 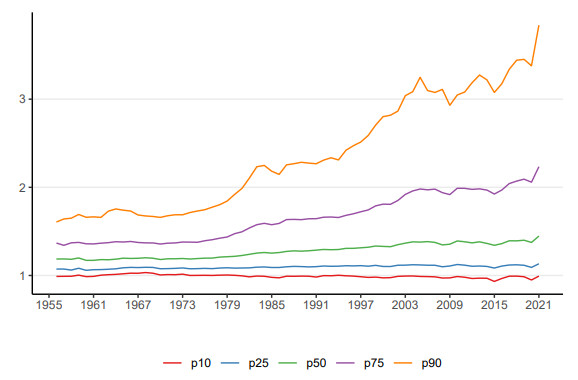
Figure 4: Distribution of markups between firms increases overall, especially at the top While 2021 didn’t change the fundamental nature of this pattern, two things stand out. First, we see that the distribution at the top (the uppermost two lines in Figure 4) pulls away even further from the rest in 2021, with record levels at the 75th and 90th percentile of the distribution. (Since these are calculated each year, firms can change their rankings.) This shows that the sharp increase in aggregate markups in 2021 seems to be driven by firms with markups in the top 10th of the distribution. However, 2021 also differs from historical trends for a different reason. Namely, we observe an increase in markups across the entire distribution (the lowermost three lines in Figure 4) as well. The median and the 25th percentile of markups, for instance, increased to their highest level on record. Though much smaller in scope, given the broad nature across the distribution, this is impactful. The larger increase at the top suggests that firms enjoying higher markups or even less competition before the pandemic may have been able to take advantage of one-time demand and supply shifts in 2021 to increase their markups further during the pandemic. But the data shows that firms with smaller markups are also increasing their markups, suggesting a shift in demand more broadly. In this sense, the existence of these markups still doesn’t tell us anything about their nature or their source. It’s not clear what our assumptions about the impact of market power should be without more formal modeling than this exercise can provide. On the one hand, market power may increase markups. Firms in a truly competitive market should be forced to set their prices equal to their marginal costs, and only in an uncompetitive market, with some firms exerting power over others, should firms have the power to price at levels which exceed their marginal costs of doing business. On the other hand, concentration might lower markups in certain instances. Some firms with a dominant market position may decide to delay or defer earnings in order to gain more market share by lowering prices below marginal costs to liquidate any further market competition. In order to try and answer these questions, we now turn to firm-level analysis. Sectoral and Regression Analysis Markups and supply We know that inflation in 2021 was largely driven by specific industry-level reopening dynamics. New and used cars plus motor parts contributed 1.9 percent of the overall 4.3 percent increase in Consumer Price Index core inflation, a notable number given autos had generally contributed a slightly negative inflation rate in the five years before the pandemic. This is true of goods in general as people shifted spending from services to goods; while from 2014 to 2019, durable goods contributed an average of 0.19 percent monthly annualized, in 2021, goods contributed 2.3 percent to inflation. In the first months of 2022, inflation did broaden, and it remains to be seen how the balance between goods and services spending and inflation levels out. Since we looked at 2021 data, we wanted to see if firm-level markups were characterized by industry composition, which would tend to suggest a supply story. For Figure 5, we took each firm’s reported two-digit North American Industry Classification System (NAICS) number and used it to sum up the difference between their 2021 size-adjusted markup and the average markup between 2018 to 2020. 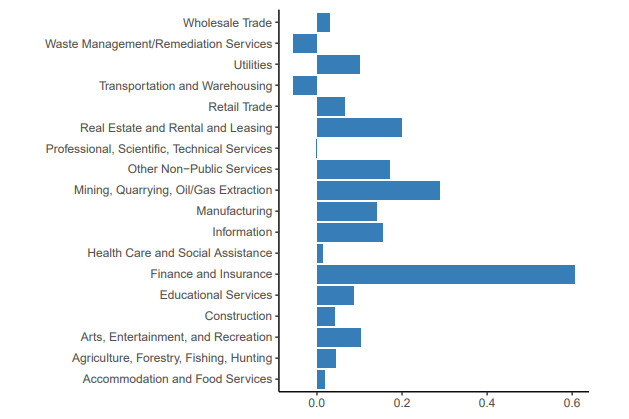
Figure 5: Markups have a strong industry story; difference between 2021 and pre-pandemic levels Markups increased much more across some industries than others, consistent with supply-side stories. Markups increased especially for finance and insurance, real estate, mining, quarrying and oil/gas extraction, manufacturing, and information. (Because of the unique nature of financial and insurance income statements, we reran our analysis with those firms excluded, and reached the same conclusions.) Using methodology from (De Loecker, Eeckhout, and Unger 2020) we can go further and decompose the increase in markups into increases within and between particular industries. Over the last several decades, markups have mostly increased within industries and not between them. This is often described as the rise of “superstar firms” that come to take over each industry, rather than something focused in a smaller number of specific industries (Autor et al. 2020). 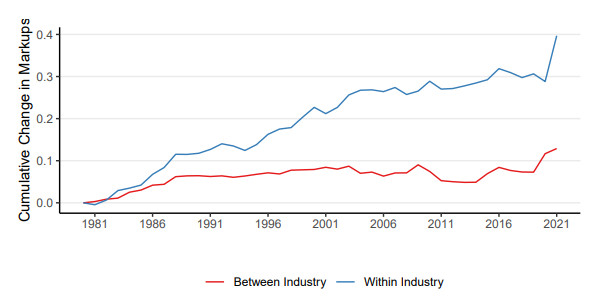
Figure 6: A partial shift from within industries to between industries Figure 6 shows the cumulative change in markups that come from within and between three-digit NAICS industries. Looking at the change in markups that come from within versus between industries, we see that from 1980 to 2019, 81 percent of the increase in markups has come from within industries, pointing to a more generalized increase in market power over this time. Markups within industries did jump sharply from 2020 to 2021, as observed in the top line. At the same time, however, markups between industries—essentially flat since 1990—also jumped significantly of late, accounting for 38 percent of the increase. This is consistent with both market power and industry-specific reopening stories leading to inflation in 2021. Demand and markups We next turn to regressions to see if a higher level of previous markups for our cross-section of firms is associated with a higher increase in markups in 2021, which would be suggestive of a market power explanation. For this, we took the average annual markup from 2018 to 2020, adjusted for firm size (SA), as our independent variable. If market power was a significant factor in increased markups, we should see previous markups as a predictor of future ones. Next, we took the SA 2021 markup and subtracted the previous period markup to get our difference, which we treated as the dependent variable. We did this with the full dataset and also excluding the top and bottom 1 percent of each of these two variables, in order to exclude outliers. The results are shown on the two figures below. Table 1, below, has a list of regressions, both with and excluding outliers, and with and without three-digit NAICS industry controls. We see strong relationships with some explanatory power in these cross-sections. Firms with 10 percent higher SA markups before the pandemic are associated with an increase in their SA margins of 2.7 or 1.6 percent. These results aren’t due to the specific base years either. We also ran the analysis with 2018 and 2019 as the baseline years and the change between then and now, as well as with 2017 through 2019 as the baseline, and found the same results for the changes during this recovery. As Table 1 also shows, if we don’t size-adjust markups, there’s a slight negative relationship between the two. However, as discussed above, size adjustment is more relevant for understanding the economy as a whole (and pricing in particular), as these firms significantly vary in size and sales. In the 2021 cross-section of firms, the 75th percentile of sales is 21 times larger than the 25th percentile; that ratio is 645 times larger for the 90th percentile versus the 10th. The sales by these small firms are less relevant to consumers, to the overall setting of prices, and to the economy as a whole. Decisions made by firms like Amazon impact the economy far more than very small firms with relatively little in sales and reach. Given that we want to see the impact on the economy just as much as the impact on each firm, we adjusted for firm size as above by multiplying firms against their percentage of total sales. 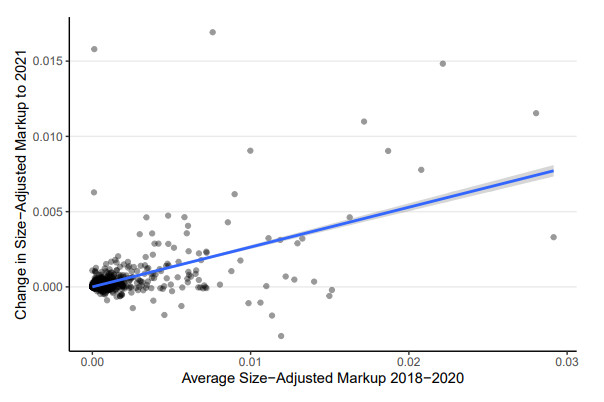
Figure 7: Positive relationship between previous size-adjusted markups and 2021 increases 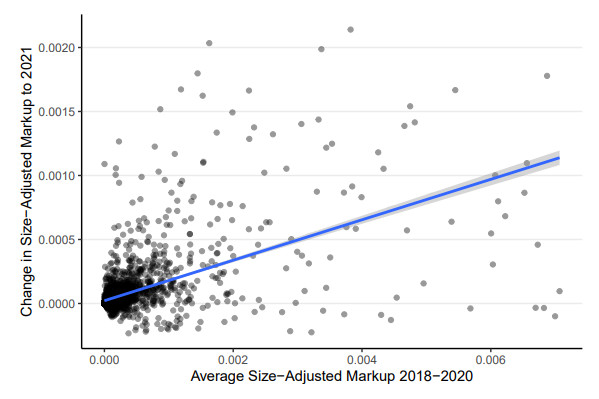
Figure 8: Relationship with outliers removed There is a chance that using revenues to adjust for size introduces a bias, as revenues are also part of the markup equation. Yet we believe revenues are the best approximation of the impact on the economy here. In order to double check our results, we also reran our analysis adjusting for firm size based on cost of goods sold and selling, general, and administrative expenses together, and found the same results. 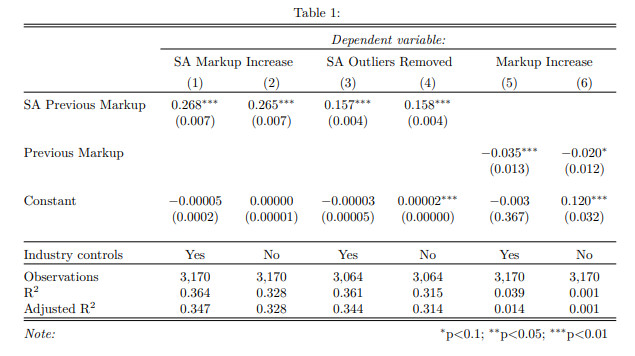
Table 1: Dependent variable: SA Markup Increase SA Outliers Removed Markup Increase Policy Implications While the idea that we are facing the threat of a wage-price spiral is becoming conventional wisdom, this brief and other research finds that changes to labor and worker compensation are not driving factors in recent markups. Indeed, workers are not the only economic agents that affect business pricing decisions. If recent research on shareholder primacy is any indication, capital plays a much bigger role than labor in C-suite decision-making calculus (Palladino 2019; Kinder, Bach, and Stateler 2022). Financial analysts, asset managers, activist investors, and a broader group of shareholders arguably have a strong role in setting incentives toward upward pricing pressures—a phenomenon that could be described as a price-profit spiral. In this account, the decision-makers in publicly traded firms are sensitive to shareholder pressure to consistently meet short-term earnings expectations and to distribute large proportions of these earnings in share repurchases and dividends. In an inflationary environment, firms that enjoy the discretion and power to adjust markups are more attractive to financial analysts and asset managers (“Pricing Power Is Highly Prized on Wall Street” 2021; Alloway 2022). If indeed companies’ pricing strategies are responsive to these sorts of short-term capital market pressures, the policymaker playbook to curbing inflation will have to expand. Even though these results may be specific to the inflation we’ve seen in 2021, markups being unusually and suddenly high means there is room for them to reverse with little economic harm and with likely societal benefit, including lower prices in the short term and less inequality and potentially more innovation in the medium term. We believe the evidence we have presented strengthens arguments for an all-of-government administrative, regulatory, and legislative approach to tackling inflation, which should include demand, supply, and market power interventions. This brief bolsters the case for the Federal Reserve to be data-driven and reflexive when it comes to raising interest rates and addressing demand. The markups revealed in our analysis reflect significant room for these margins to come down, as well as for any wage increases to be absorbed within the firm without the need for price increases. Over the past 40 years, the profit share did come down in a recovery (Bivens 2022a). Also, efforts to increase supply, through targeted investments in supply chains, productive capacities, housing, and care work can help alleviate price pressures and help bring down these margins. This brief also underlines the role of firms’ power and discretion to adjust their markups. There was already a strong case for increasing antitrust scrutiny of the corporate sector before the pandemic. Increasing competition and reducing market power would bring down inflation to some degree, no matter its cause. The evidence we present here argues that additional scrutiny could help bring down margins more. We also show how widespread excess profits have become, substantiating the case for an excess profit tax as a way of distributing runaway economic gains while simultaneously eroding company incentives to increase their markups (Gneiting, Lusiani, and Tamir 2020; Avi-Yonah 2020). Conclusion In our analysis, we find that firms increased their markups substantially in 2021, both to their highest level and with the largest single-year increase since 1955. Firm profitability, both before and after taxes, also increased to its highest levels. This sharp annual increase in markups was driven to a large degree by firms with markups in the top 25th percentile of the distribution. Compared to recent decades, this was also driven by shifts across firms and across industries. Regressing firm-level changes, we found that, adjusting for size, there’s a significant relationship between a firm’s average markup before the pandemic and the amount the firm has increased the markup since. A 10 percent increase in firms’ pre-pandemic size-adjusted markups is associated with an increase between 1.6 and 2.7 in their markups in 2021. In addition to showing that both demand and supply factors are behind the increases in markups, this evidence suggests that firms facing less competition before the pandemic have been able to take advantage of the one-time demand-and-supply shifts to increase their markups since, suggesting market power to be a third explanatory factor in inflation in 2021. Bibliography
| The text being discussed is available at | and |