|
Arctic Ice Melt
Observation of ice melt has been going on for several decades. There are indications that the process of ice melt is accelerating rather than going more slowly.
|
|
|
|
Global temperature and Carbon Dioxide
|
|

|
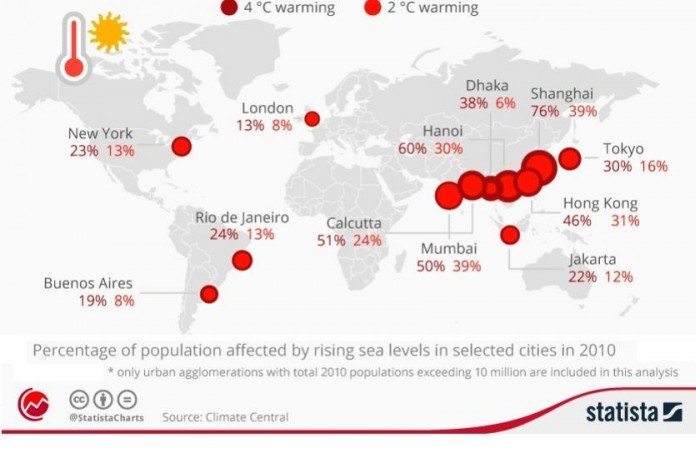
POPULATION AT RISK DUE TO SEA LEVEL RISE
The population of many major cities will be adversely affected by sea level rise
|
|
|
|
2015-916-NPS-NRR-Coastal-Assets-Exposed-to-1m-of-Sea-Level-Rise-Peek-et-al
National Park Service ... Adapting To Climate Change in Coastal Parks
Estimating the Exposure of Park Assets to 1 m of Sea-Level Rise
'http://truevaluemetrics.org/DBpdfs/ClimateChange/SeaLevelRise/2015-916-NPS-NRR-Coastal-Assets-Exposed-to-1m-of-Sea-Level-Rise-Peek-et-al.pdf'
| Open PDF ...
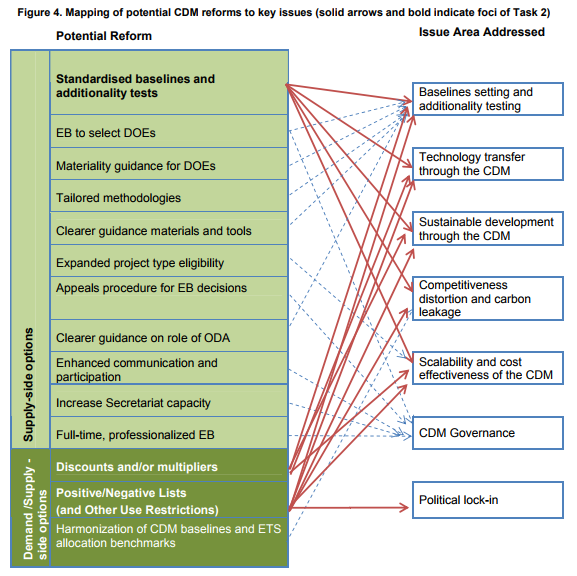
SEI-Study-on-the-Integrity-of-the-Clean-Development-Mechanism-2011
|
|
|
State-of-the-Beach-Report-2017
The goal of Surfrider’s State of the Beach Report Card is to make the public aware of the ever-growing erosion problem facing our beaches and improve how municipalities and agencies respond to
erosion and sea level rise.
'http://truevaluemetrics.org/DBpdfs/ClimateChange/SeaLevelRise/State-of-the-Beach-Report-2017.pdf'
| Open PDF ...
State-of-the-Beach-Report-2017
|
|
EXTREME WEATHER EVENTS - 2012
|
|
Superstorm Sandy
A fierce storm with enormous energy ...
|
|
|
Superstorm Sandy
A coastline destroyed: Terrifying pictures show the devastation wreaked on New Jersey's shores by Sandy
|
Open file 12948
|
|
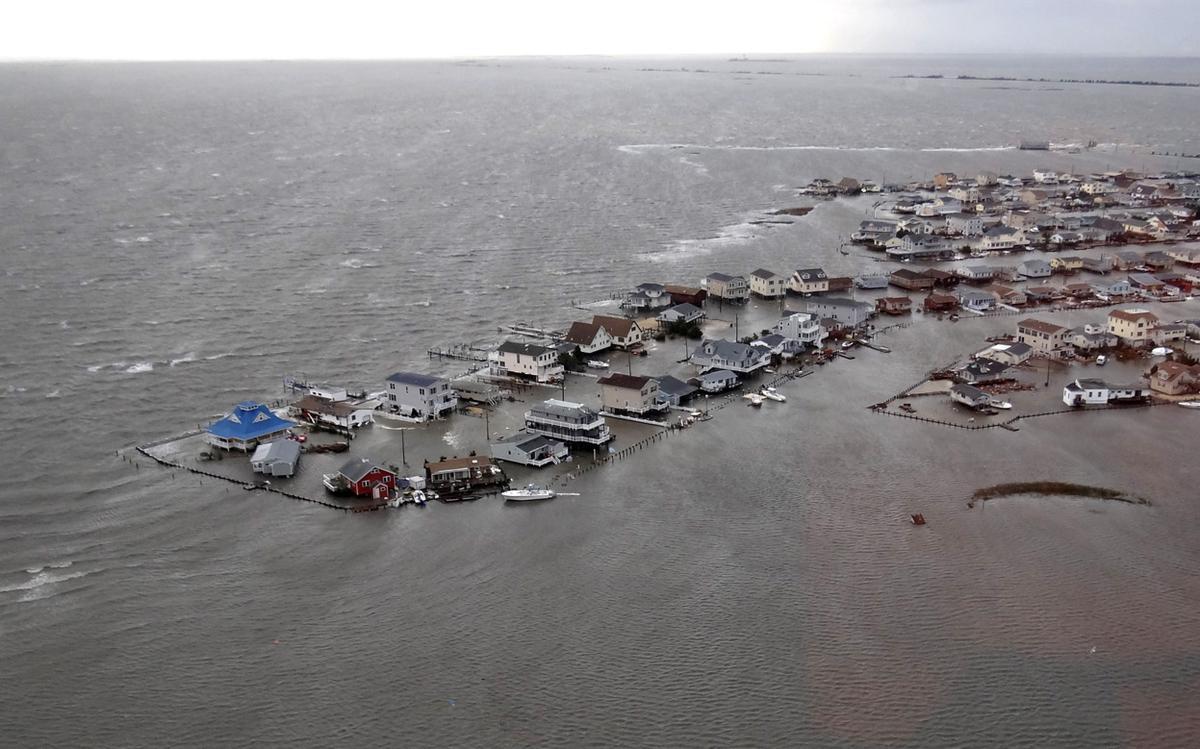
Impact of Superstorm Sandy on New Jersey
Homes, flooded after Hurricane Sandy made landfall on the southern New Jersey coastline, on October 30, 2012 in Tuckerton, New Jersey.
|
|
|
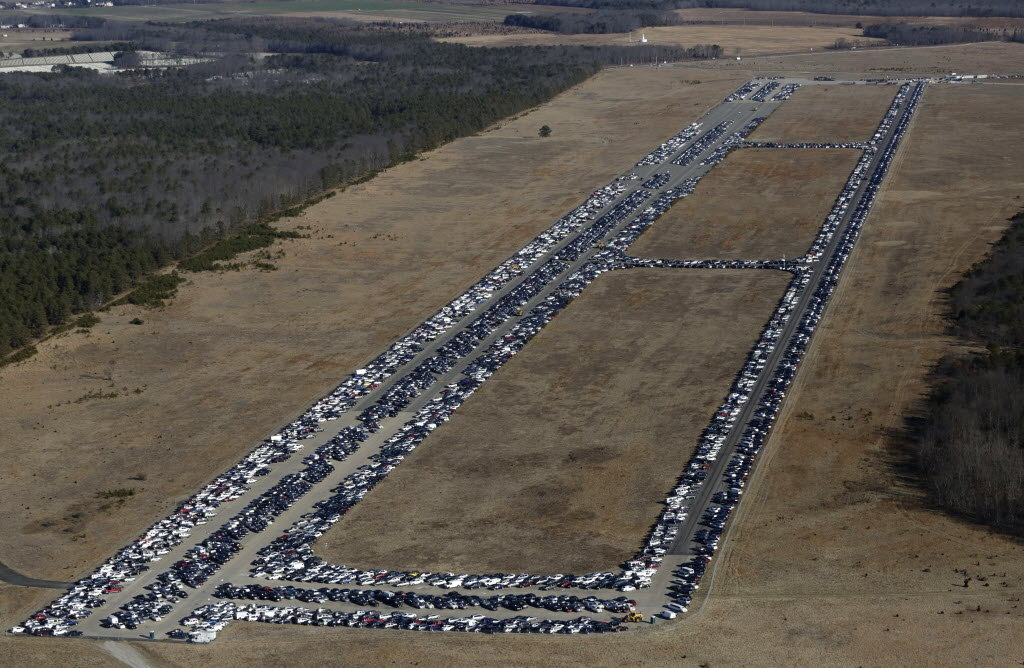
The Economic Damage Associated with Superstorm Sandy
An aerial photo of Jan 18 2013 shows thousands of cars damaged during Superstorm Sandy and stored on the runways at an airport in Calverton, N.Y.
|
|
HURRICANE HARVEY - 2017
SOUTH TEXAS ... HOUSTON / BEAUMONT / WESTERN LOUISIANA
|
HURRICANE IRMA - 2017
CARIBBEAN ISLANDS / FLORIDA / GEORGIA / CAROLINAS
|
|
REPORTS on CLIMATE ISSUES
|
|
SEI-Study-on-the-Integrity-of-the-Clean-Development-Mechanism-2011
(81 pages)
Has Joint Implementation reduced GHG emissions? Lessons learned for the design of carbon market mechanisms
Anja Kollmuss, Lambert Schneider and Vladyslav Zhezherin ... Stockholm Environment Institute
Analysis of impact of Joint Implementation Kyoto Protocol to generate Emission Reduction Units (ERUs) from greenhouse gas (GHG) reduction projects
'http://truevaluemetrics.org/DBpdfs/Carbon/SEI/SEI-Study-on-the-Integrity-of-the-Clean-Development-Mechanism-2011.pdf'
| Open PDF ...
SEI-Study-on-the-Integrity-of-the-Clean-Development-Mechanism-2011
|
|
|
TRUMP ADMINISTRATION AGAINST THE ENVIRONMENT
Doing everything they can to stop essential remediation
|
GO TOP
|
|
|
EDF-171028-Trump-Presidency-An-Unprecedented-Attack
Now, the Trump Administration is working to undermine two critical victories:
First, the Department of Interior announced they working to unravel much-needed limits on the amount of natural gas industry is allowed to waste through venting, leaking, and burning off (in a process called 'flaring') on our public and tribal lands.
Then, EPA Administrator Scott Pruitt announced a proposal to repeal the Clean Power Plan—America's first-ever national limits on the carbon pollution spewing from our fossil fuel-fired power plants.
'http://truevaluemetrics.org/DBpdfs/ClimateChange/EDF/EDF-171028-Trump-Presidency-An-Unprecedented-Attack.pdf'
| Open PDF ...
EDF-171028-Trump-Presidency-An-Unprecedented-Attack
|
|
|
Report on sea climate change related metrics attributed to specific carbon producing companies
12 pages
The rise in global atmospheric CO2, surface temperature, and sea level from emissions traced to major carbon producers
B. Ekwurzel 1 & J. Boneham2 & M. W. Dalton2,3 & R. Heede 4 & R. J. Mera1,5 & M. R. Allen2 & P. C. Frumhoff 6
Received: 19 August 2016 /Accepted: 23 April 2017
# The Author(s) 2017. This article is an open access publication
'http://truevaluemetrics.org/DBpdfs/ClimateChange/CrossMark/CrossMark-climate-change-2017.pdf'
| Open PDF ...
CrossMark-climate-change-2017
|
|
|
| |
|
|
UNLOCKING POTENTIAL ... State-of-the-Voluntary-Carbon-Markets-2017-Executive-Summary
'http://truevaluemetrics.org/DBpdfs/NaturalCapital/ForestTrends/State-of-the-Voluntary-Carbon-Markets-2017-Executive-Summary.pdf'
| Open PDF ...
State-of-the-Voluntary-Carbon-Markets-2017-Executive-Summary
|
|
|
UNLOCKING POTENTIAL ... State-of-the-Voluntary-Carbon-Markets-2017-Full-Report
'http://truevaluemetrics.org/DBpdfs/NaturalCapital/ForestTrends/State-of-the-Voluntary-Carbon-Markets-2017-Full-Report.pdf'
| Open PDF ...
State-of-the-Voluntary-Carbon-Markets-2017-Full-Report
|
|
|
Organization: Forest Trends ... Staff List / details
Staff list, short bios of staff at Forect Trends
|
Open file 13923
|
'../../DBpdfs/Carbon/TCFD-Report-Letter-2016-12-21.pdf'
'../../DBpdfs/Carbon/TCFD-Report-Overview-2016-Dec.pdf'
|
|
Banking-On-Climate-Change-2017
This 8th annual Fossil Fuel Finance Report Card grades fossil fuel policies and tabulates financing from 37 major private banks from across Europe, the United States, Canada, Japan, China, and Australia.
'http://truevaluemetrics.org/DBpdfs/Banking/Banking-On-Climate-Change-2017.pdf'
| Open PDF ...
Banking-On-Climate-Change-2017
|
Impact of climate change on New York City’s coastal flood hazard: Increasing flood heights from the preindustrial to 2300 CE
Coastal flooding poses a major risk to New York City (NYC), which has nearly 49.7 million built square meters and 400,000 people living within the 100-y floodplain (1). The coastal flood risk was illustrated in 2012, when Hurricane Sandy’s storm surge of 2.8 m above the mean tidal level (MTL) at the Battery tide gauge produced an estimated $50 billion of damage to the
region (2). Under a changing climate, the coastal flood risk to NYC is unknown
Andra J. Garnera,b,1, Michael E. Mannc,d, Kerry A. Emanuele, Robert E. Koppb,f, Ning Ling, Richard B. Alleyh,Benjamin P. Hortona,b,i,j, Robert M. DeContok, Jeffrey P. Donnellyl, and David Pollardd
Report
... 6 pages
'http://truevaluemetrics.org/DBpdfs/ClimateChange/PNAS/PNAS-2017-Garner-1703568114.pdf'
|
Open PDF ...
PNAS-2017-Garner-1703568114
|
Supplemetary information
... 15 pages
'http://truevaluemetrics.org/DBpdfs/ClimateChange/PNAS/PNAS-2017-Garner-1703568114-with-supplementary-info.pdf'
|
Open PDF ...
PNAS-2017-Garner-1703568114-with-supplementary-info
|
|
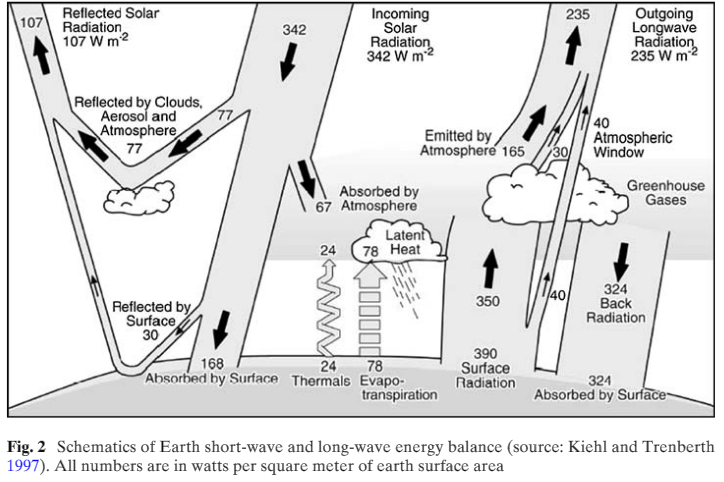
An Energy Balance
This energy balance maybe the most important for an equilibrium we can live with!
|
|
Heat Flow and energy balance
This is a complicated natural system. It is a system that has taken a very long time to stabilize.
During the last 200 years there has been a massive increase in human economic activity that has changed some of the flows in the system, so that the system is no longer in equlibrium.
The changes in the energy balance manifests as increased global temperature.
In turn, increase global remperature destabilizes other dimensions of the global ecosystem / biosphere
At the peak of the ice age global temperature was only some 6oC lower than where we have been for the last several thousand years ... with global temperatuve rising in the last 200 years by 1oC and accelerating. The indications are that the system is entering a period of dangerous instability.
|
|
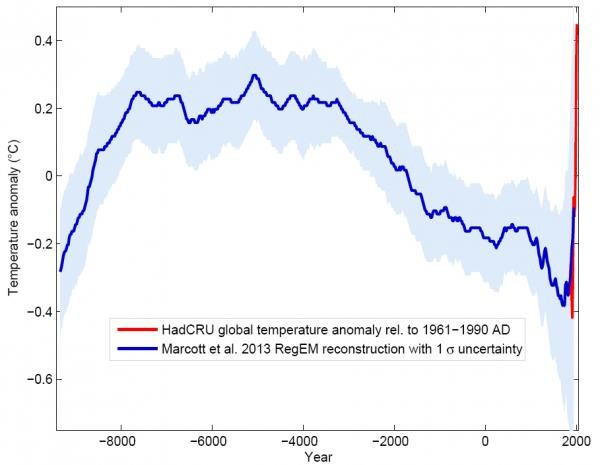
The last 10,000 years
|
|
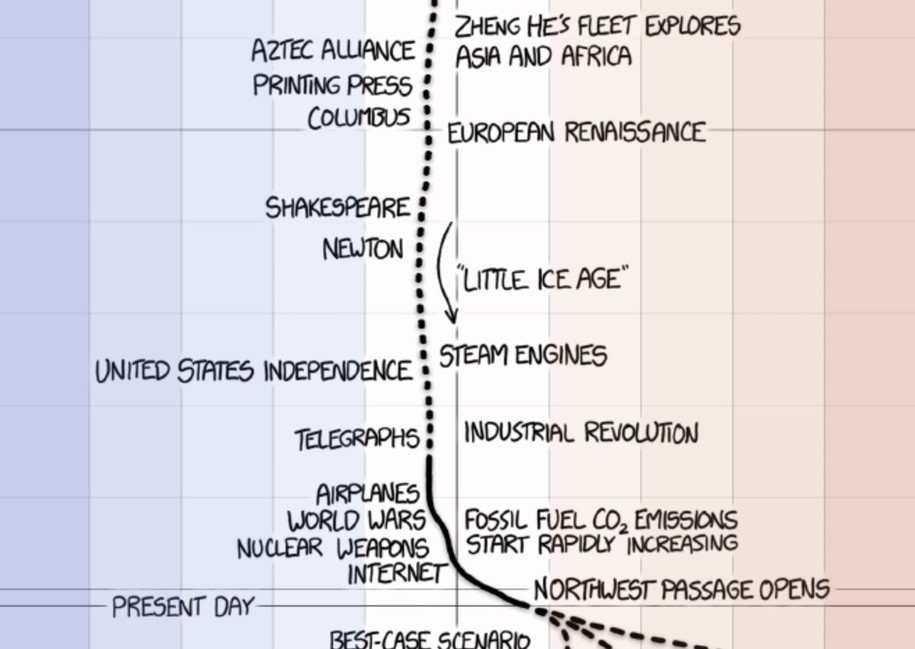
Very long term temperative change ... a period of 10,000 years
The temperature rise in the last hundred years is 'off the chart'
|
The rising tide: assessing the risks of climate change and human settlements in low elevation coastal zones
GORDON MCGRANAHAN, DEBORAH BALK and BRIDGET ANDERSON
ABSTRACT
Settlements in coastal lowlands are especially vulnerable to risks
resulting from climate change, yet these lowlands are densely settled and growing
rapidly. In this paper, we undertake the first global review of the population and
urban settlement patterns in the Low Elevation Coastal Zone (LECZ), defined here
as the contiguous area along the coast that is less than 10 metres above sea level.
Overall, this zone covers 2 per cent of the world’s land area but contains 10 per cent
of the world’s population and 13 per cent of the world’s urban population. A disproportionate
number of the countries with a large share of their population in this
zone are small island countries, but most of the countries with large populations
in the zone are large countries with heavily populated delta regions. On average,
the Least Developed Countries have a higher share of their population living in
the zone (14 per cent) than do OECD countries (10 per cent), with even greater
disparities in the urban shares (21 per cent compared to 11 per cent). Almost twothirds
of urban settlements with populations greater than 5 million fall, at least
partly, in the zone. In some countries (most notably China), urbanization is driving
a movement in population towards the coast. Reducing the risk of disasters related
to climate change in coastal settlements will require a combination of mitigation,
migration and settlement modification.
KEYWORDS climate change / coastal / global / hazards / population distribution / urbanization
|
'http'//truevaluemetrics.org/DBpdfs/ClimateChange/SeaLevelRise/Sea-level-rise-2007.pdf'
|
Open PDF ...
Sea-level-rise-2007
|
'http://unfccc.int/files/adaptation/application/pdf/nwpexpert_mcgranahan_balk_anderson_2007.pdf'
|
Open external link
|

Boston USA
|

Washington DC USA
|

Montreal Canada
|

New York USA
|
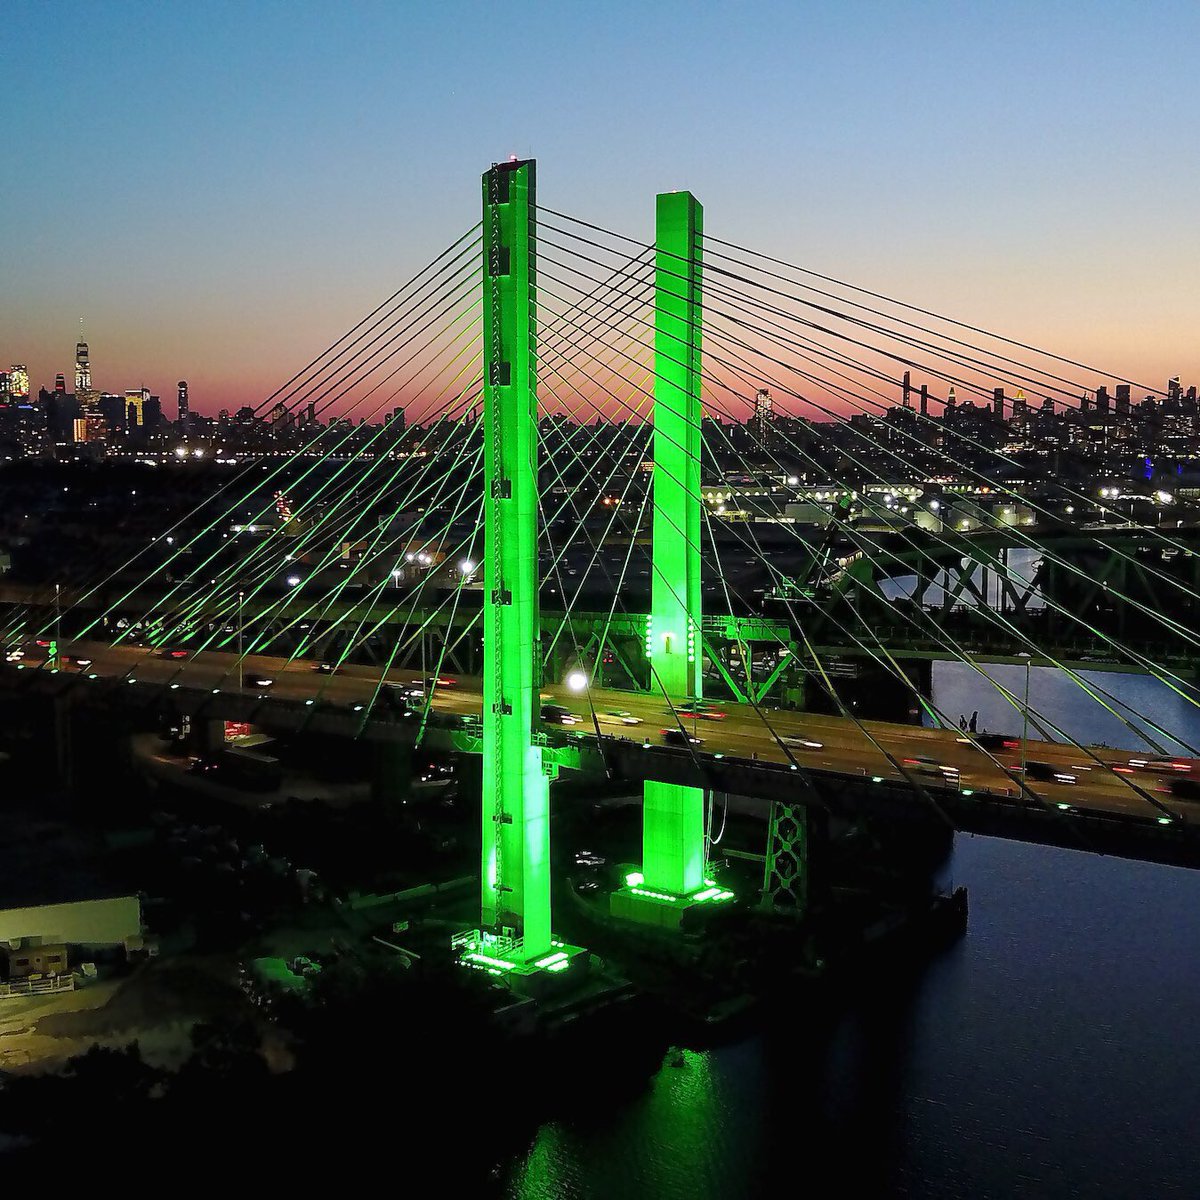
New York USA
|
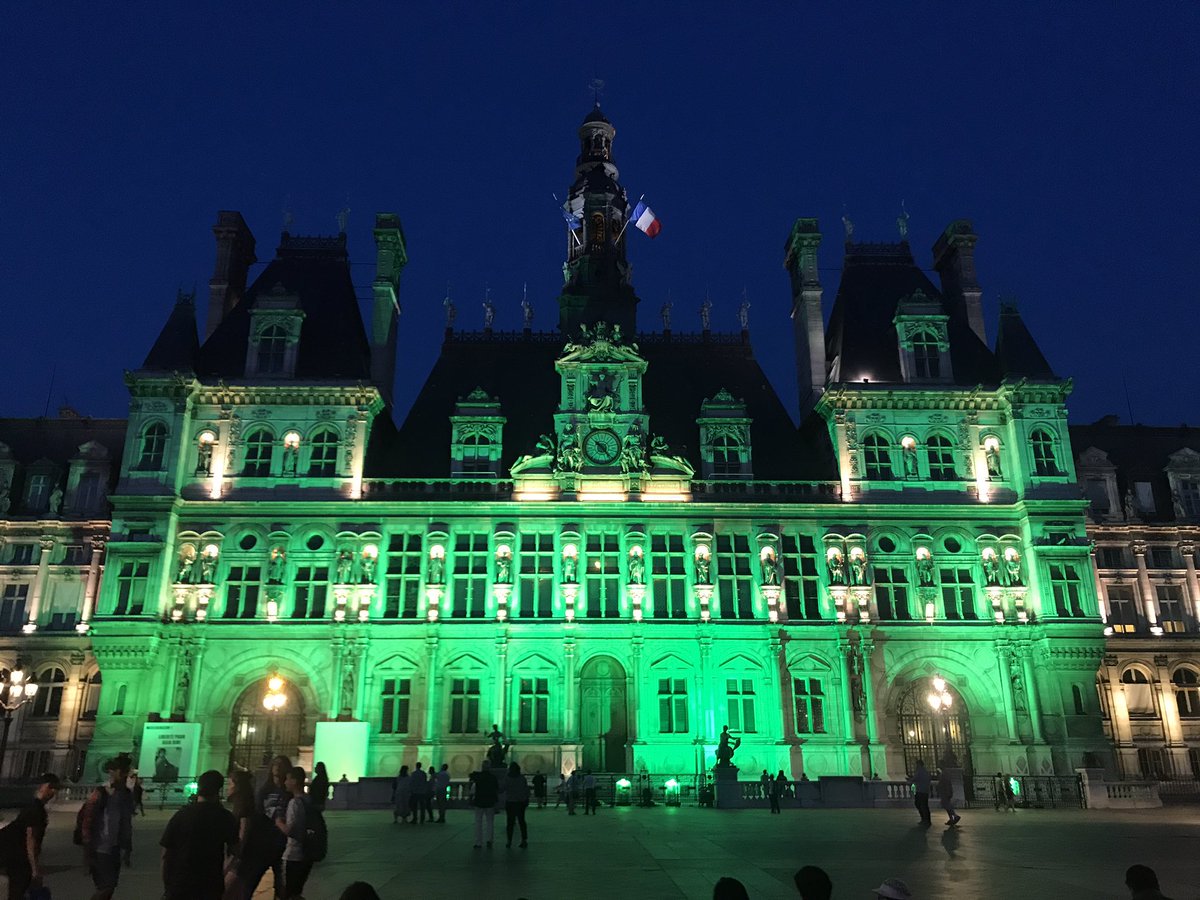
Paris
|

Barcelona
|

Mexico City, Mexico
|
Stockholm Sweden
|
|
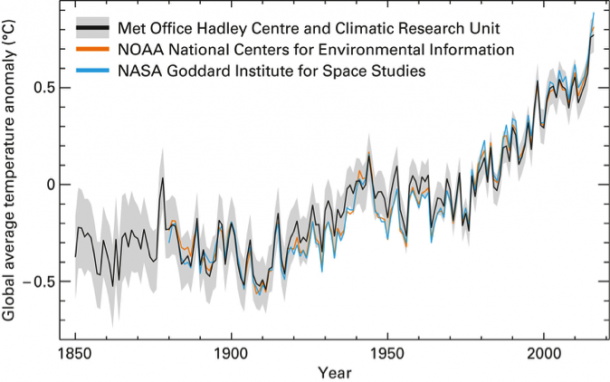
Global Temperature Rise
|
|
Temperature rise
Global temperatures are on the rise again as 2016 has been marked as the hottest on record.
|
|
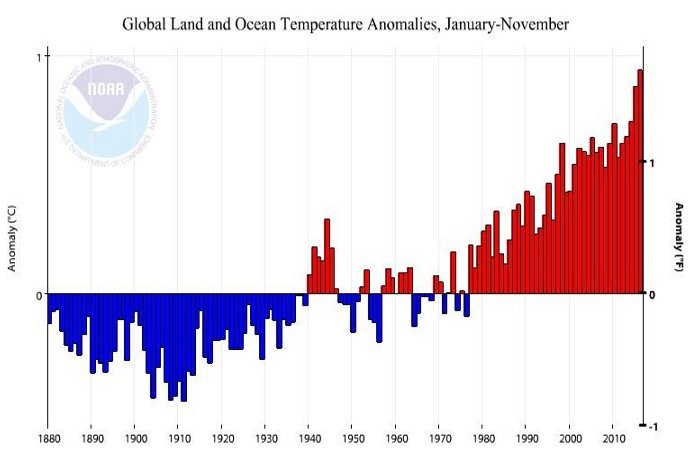
Global ocean temperature anomolies from 1880 to 2016
The temperature rise post 1980 has been continuous ... reflecting the massive increase in scale of industrial activity in the post war years.
|
|
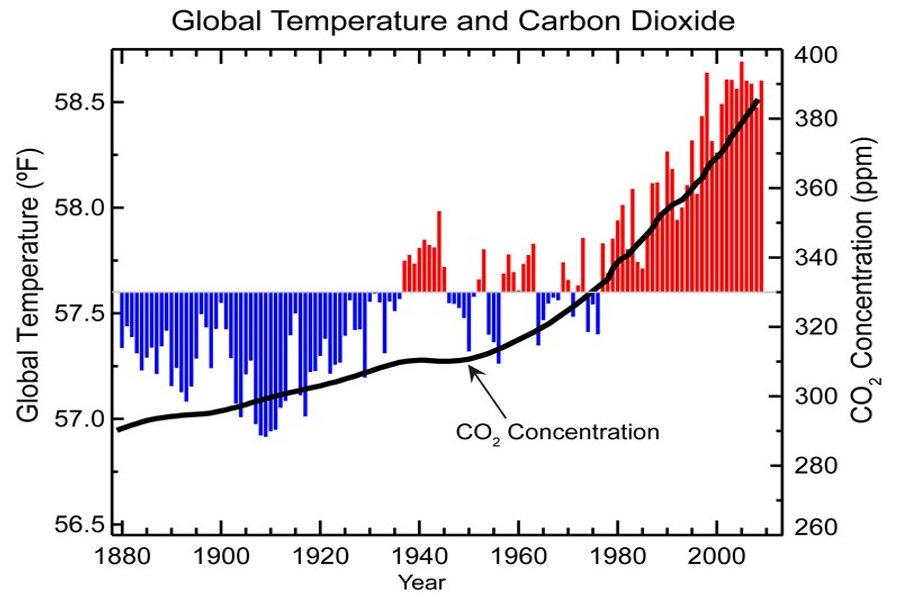
Correlation and Causality for Temperature Rise
|
|
Global temperature and Carbon Dioxide
The level of carbon dioxide in the atmosphere has increased significantly over the same period 1880 to 2016
|
Ice Melt
Ice melt is caused by rising temperatures
|
|
|
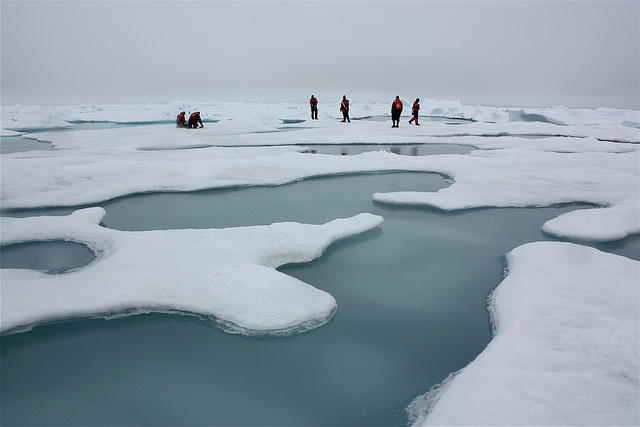
Arctic Ice Melt
Observation of ice melt has been going on for several decades. There are indications that the process of ice melt is accelerating rather than going more slowly.
|
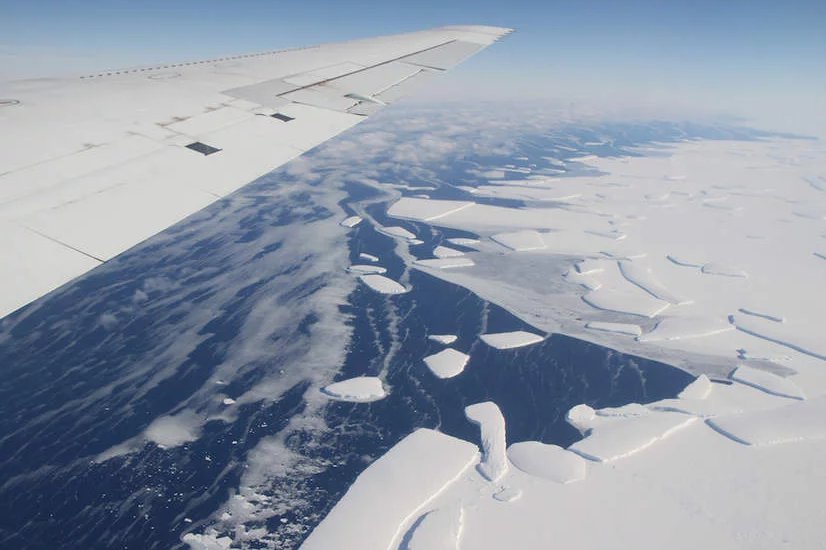
Credit: Calving front of the West Antarctic Ice Sheet. Credit: NASA, public domain
|
Antarctic Ice Melt
|
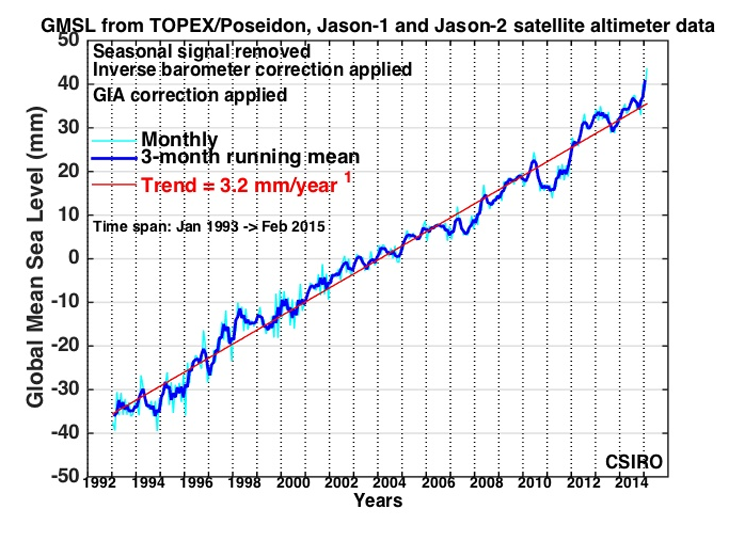
Sea Level Rise
Most of sea level rise is caused by ice melt
|
|
Sea Level Rise ... 1992 to 2016
Multiple measures for sea level rise show sea level rise has been substantial in recent years
|
NPS-2018-Sea-Level-Change-Storm-Surge-Report.pdf
This report on Sea Level Rise and Storm Surge Projections for the National Park Service shows how many National Parks will be impacted by sea level rise
'http://truevaluemetrics.org/DBpdfs/ClimateChange/NPS/NPS-2018-Sea-Level-Change-Storm-Surge-Report.pdf'
|
Open PDF ...
NPS-2018-Sea-Level-Change-Storm-Surge-Report
|
Coastal Flooding
Coastal flooding is caused by a combination of sea level rise, storm surges and rainstorms
|
|
A large part of the world's population live in cities that are becoming affected more and more by sea level rise and related flooding.
This map highlights cities around the world that have large populations likely to be affected by sea level rise. To give this context, the area around New York has been identified, but the coastal areas of the US Gulf Coast and the coastal areas of Florida are not identified.
Extreme weather events are becoming much more frequent. Hurricane force winds cause damage to property and injure and kill people. These winds also produce storm surges that together with ocean rise cause flooding. Unusually large amounts of rainfall also cause flooding. All of this causes massive economic loss and terrible social disruption.
|
|
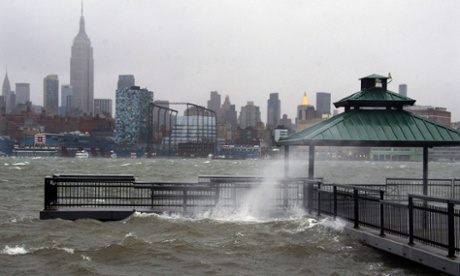
Superstorm Sandy ... October 2012
|
|
|
Superstorm Sandy
A coastline destroyed: Terrifying pictures show the devastation wreaked on New Jersey's shores by Sandy
|
Open file 12948
| |
|
|
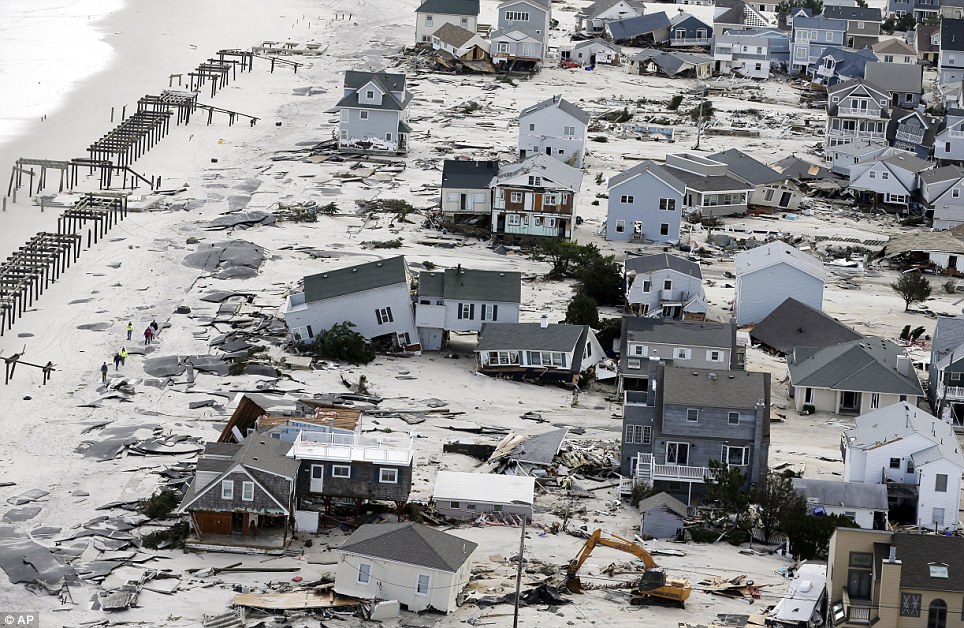
Impact of Superstorm Sandy on New Jersey
Homes, flooded after Hurricane Sandy made landfall on the southern New Jersey coastline, on October 30, 2012 in Tuckerton, New Jersey.
|
|
|
|
|
The Economic Damage Associated with Superstorm Sandy
An aerial photo of Jan 18 2013 shows thousands of cars damaged during Superstorm Sandy and stored on the runways at an airport in Calverton, N.Y.
|
|
|
A stunning danger lurking under the ice ... a video about the beauty of this lake in Alberta that is a substantial source of naturally occurring methane
https://www.bbc.com/reel/video/p05y1dbd/a-stunning-danger-lurking-under-the-ice
|
Open external link
|
| The text being discussed is available at
and
| |