
OVERVIEW
MANAGEMENT
PERFORMANCE
POSSIBILITIES
CAPITALS
ACTIVITIES
ACTORS
BURGESS
|
US ECONOMY
EXCEPTIONAL PERFORMANCE NOT BEING REPORTED Biden's Economy Has the Best Growth Record Since Clinton Then again, inflation under Biden is the worst since Carter, so there’s no cause for celebrating yet. 
An economic report card. Photographer: Oliver Contreras/Bloomberg Original article: https://www.bloomberg.com/opinion/articles/2022-08-31/biden-s-economy-has-the-best-growth-record-since-clinton?srnd=opinion Peter Burgess COMMENTARY I have drafted this letter to the author and editor of this Bloomberg Opinion piece. So far I have not sent it .......... Dear Justin ... Dear Susan I was a young CFO in the USA in the 1970s and got to learn about inflation first hand ... it was referred to back then as 'cost-push' inflation because the core energy costs throughout the non-OPEC world were going up and up and up. Before 1973 the crude oil price was less than $3.50 a barrel. During 1973 it went up to $13.40 and by the end of the decade was more than $30.00 a barrel. Corporate profits in almost every sector of the US economy evaporated, and prices were pushed up to cover the cost increases. There was little or no 'embedded profit' in any of the supply chains. Fast forward to the present time and the business economics are completely different. The energy sector is not dominated by OPEC in the same way, and the US economy is less dependent on imported energy than it once was. Most sectors of the US economy are at record levels of profitability and the same goes for many parts of the global economy. Inflation is now being caused by the decisions of corporate boards to maximize prices and profits because at this point in the business cycle 'They can' and history shows that leaders in the business community have always done this unless there are draconian measures to stop them. I learned accountancy in the UK in the 1960s and as part of my training did some of the 'grunt work' on the tax returns of some high net worth individuals and major companies in the UK. Starting in the war years and continuing at least into the 1960s there were very high tax rates ... like in excess of 90% marginal tax rate ... applied to high levels of individual remuneration and higher profits than the historic norms. The modern economy has been 'financialized' in an impressive way if you look at it from the point of view of a financial investor ... and the present inflation will not hurt investors anything like as much as it will impact the majority of the US population. From my perspective, the Biden administration has done a commendable job of legislating to improve the US economy in spite its razer thin majority in Congress and little or no support across the aisle ... or indeed in the media. I have just done a road trip from the New York area to Denver (and back by plane). I did many trips like this in the 1960s when I was in my 20s mainly by Greyhound bus. My big surprise was that I was seeing a different America than what I seem to have been reading about in the media .. left, right, mainstream and social. All the bad news that's fit to read seems to be editorial policy and reporting on the truly good news nowhere to be found. Sad............... Peter Burgess | ||
|
Biden's Economy Has the Best Growth Record Since Clinton
Then again, inflation under Biden is the worst since Carter, so there’s no cause for celebrating yet. Written by Justin Fox ... Justin Fox is a Bloomberg Opinion columnist covering business. A former editorial director of Harvard Business Review, he has written for Time, Fortune and American Banker. He is author of “The Myth of the Rational Market.” @foxjust August 31, 2022 at 7:00 AM EDT We’re more than a year-and-a-half into Joe Biden’s presidency, with full second-quarter economic growth numbers from the US Bureau of Economic Analysis now in hand. Which seems like as good a time as any for another installment in my occasional series comparing growth rates under US presidents — which somewhat to my surprise shows Biden on pace to compile by far the best growth record since Bill Clinton. Presidents and Economic Growth Annualized growth in the average of real gross domestic product and real gross domestic income from first to last quarter in office* 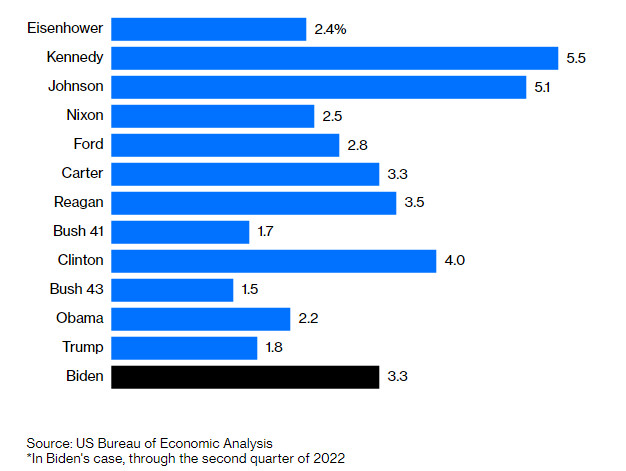
Source: US Bureau of Economic Analysis ... *In Biden's case, through the second quarter of 2022 Yes, this is adjusted for inflation, albeit using the gross domestic product price index, which hasn’t been rising quite as fast as the better-known consumer price index (7.6% year-over-year in the second quarter versus 8.6% for the CPI). And yes, I measure growth here using not GDP alone but the average of GDP and another metric tracked by the BEA, gross domestic income. In theory GDP and GDI should be equal, but they are estimated from different sources and so far this year are showing very different economic trajectories for the US. GDP fell at a 1.6% annualized rate in the first quarter and 0.6% in the second, according to the latest BEA estimates, while GDI rose 1.8% and 1.4%. There have been a lot of complaints lately that the Biden administration and the media are shifting the goalposts on how recessions are defined by looking past those two consecutive quarters of negative GDP growth to other indicators such as payroll employment, industrial production and real incomes that show continued growth. In reality, the National Bureau of Economic Research has been the semi-official arbiter of when US recessions start and end since well before there was such a thing as GDP, and economists there have continued to focus on data series more frequent and less susceptible to subsequent revision than the quarterly GDP numbers. By using an average of GDP and GDI to measure economic growth I really am shifting the goalposts, but I think it’s justified. Interest in the metric, which the BEA began mentioning in its quarterly GDP reports in 1998, began picking up in the late 2000s after Jeremy Nalewaik, an economist then at the Federal Reserve Board and now at Goldman Sachs, argued in a 2006 working paper that GDI “has done a better job recognizing the start of recessions” than GDP. The NBER’s Business Cycle Dating Committee first referenced GDI in one of its recession announcements in 2008. In 2013 the Federal Reserve Bank of Philadelphia began reporting what it calls GDPplus, which combines GDP and GDI in a “statistically optimal” way and is currently showing annualized economic growth of 2% in the first quarter of this year and 1.8% in the second. In 2015 the BEA started reporting the simple average of GDP and GDI that I use here. This currently shows growth of 0.1% in the first quarter and 0.4% in the second. The first GDI estimate for each quarter comes out a month later than the first GDP estimate, and unless that changes it’s hard to imagine GDI or the GDP/GDI average supplanting GDP in public discussion. But economists and economic journalists, myself included, have been giving these measures more and more attention with each passing quarter. Right now, this happens to makes the economic performance of the Biden administration look better than GDP alone does. For whatever it’s worth, it also makes economic growth under his predecessor look better. Presidents and GDP Growth Annualized growth in real gross domestic product from first to last quarter in office* 
Source: US Bureau of Economic Analysis ... *In Biden's case, through the second quarter of 2022 Measured by real GDP alone, growth under Biden is 0.6 percentage points slower than by the GDP/GDI average — and 1.3 points below the 4% growth rate for GDI. It’s still the best since the Clinton years. For Donald Trump, the growth hit is smaller but puts him in last place among the presidents listed here. Quarterly GDP data is only available back to 1947, which is why this chart starts with Eisenhower, but annual data show that GDP growth under Trump was the slowest since Herbert Hoover’s less-than-successful presidency. I wrote a column last year with a headline to that effect, and heard from readers who felt that it was unfair to Trump because he faced the historic bad luck of a once-in-a-century pandemic. It’s true that the pandemic was bad luck, and that US economic performance during Trump’s final year in office actually stacked up well versus other rich countries. But while growth under Trump before the pandemic was a much more respectable 2.6% annualized for GDP and 2.5% for the GDP/GDI average, earlier presidents also faced economic setbacks not of their own making, and without adjusting for those (and I’m not sure how I would do that) it doesn’t seem right to give Trump special treatment in such a comparison. Of course, lots can still happen during Biden’s tenure, too. At this point in Trump’s presidency, GDP/GDI growth was 2.8% annualized and GDP growth 3.1%. It slowed after that, even before the pandemic. Whether the US economy falls into recession or not, growth has clearly downshifted this year. So far in the 21st century, US GDP/GDI has grown at a 2% annualized rate and GDP 1.9%. I would guess that the longer Biden is in office, the closer the growth rate will get to those numbers. Also, economic growth during a president’s time in office is a flawed measure of economic impact. There’s the already-discussed role of luck, the built-in limitations of GDP and similar measures in reflecting how economic rewards are shared and whether they’re sustainable, and the simple fact that policy choices under one president can affect growth well after that president leaves the White House. I can’t adjust for all of those things, but I can at least use several different ways of measuring growth to make clear that no single number is right. Contrasting GDP with the average of GDP and GDI is one approach. Another is to time-shift, starting measurement from the quarter before a president takes office or the quarter after. Presidents and Economic Growth, Time-Shifted Annualized growth in the average of real gross domestic product and real gross domestic income
Source: US Bureau of Economic Analysis ... *In Biden's case, through the second quarter of 2022 For presidents who served two full terms, these shifts don’t change the picture much. For those with very short tenures, such as Gerald Ford and Biden so far, the differences in growth rates can be large — although however you slice it growth so far under Biden remains the fastest since Clinton. Population growth is an important factor affecting economic growth that, while not entirely outside of a president’s control, seems determined mainly by other forces. Adjust for that by looking at per-capita economic growth, and the picture changes yet again. Presidents and Per-Capita Economic Growth Annualized growth in per-capita average of real gross domestic product and real gross domestic income from first to last quarter in office*
Source: US Bureau of Economic Analysis ... *In Biden's case, through the second quarter of 2022 This seems quite unfair to Dwight Eisenhower, given that the rapid population growth during his presidency consisted almost entirely of babies who weren’t really in a position yet to contribute much to the economy. But it puts more recent presidents’ economic performance in a justifiably more favorable light. And whaddya know: by this measure, growth under Biden is the fastest since the presidency of Lyndon Johnson. Again, I wouldn’t make too much of that! But it’s so different from current public perceptions of the economy that it’s worth pausing to understand why that might be. Presidents and Inflation Annualized increase in consumer price index from first to last month in office*
Source: US Bureau of Economic Analysis ... *In Biden's case, through the second quarter of 2022 Consumer prices have risen at a faster pace so far in the Biden presidency than under any president since Jimmy Carter. People really hate inflation. Until it slows, Biden won’t be getting a lot of credit for the pace of economic growth — and bringing it down may require slowing that growth pace even more. ----------------------------------------------- More From Other Writers at Bloomberg Opinion:
| The text being discussed is available at | https://www.bloomberg.com/opinion/articles/2022-08-31/biden-s-economy-has-the-best-growth-record-since-clinton?srnd=opinion and |