WRONG-METRICS
Modern technology makes wrong metrics more
dangerous than they have ever been before
|
|
NO METRICS are the ultimate in WRONG METRICS
There are very powerful and widely accepted metrics for reporting profit, reporting stock market prices and indices , and for computing GDP ... all of which are reported frequently.
- There are NO METRICS that have similar ease of use and rigor about quality of life and all the issues associated with individual people.
- There are NO METRICS that are used to report on the state of the environment and how it is changing.
- There are NO METRICS being used to report on how risks of various sorts are going to impact the future.
When there are NO METRICS the takeaway default becomes ZERO ... and this is usually just plain WRONG!
|
|
|
MEASURE WHAT MATTERS
Financial metrics are powerful ... but on their own,
they are insufficient and produce the wrong results
|
GO TOP
|

|
Peter Drucker famously said 'You cannot manage what you don't measure'
This is undounbtedly true ... in the corporate world, the components that go into making profit are measured intensely in order to improve profit performance ... and it works!
Unfortunately, we don't do anything like the same amount of measuring in order to improve society and avoid degrading the environment ... and we don't have any easy way of talking about social performance and environmental performance in the same way that we are able to talk about corporate performance and investment portfolio performance.
This has to change ... this is what True Value Impact Accounting (TVIA) is all about
When numbers about progress and performance are missing, then there is no conversation that is grounded in reality and it becomes easy to promulgate 'fake news' and the appearance of good performance without much reality.
|
|
|
MONEY MEASURES
Good for financial performance ... but on their own,
they are insufficient and produce the wrong results
|
GO TOP
|
CORPORATE PROFITS
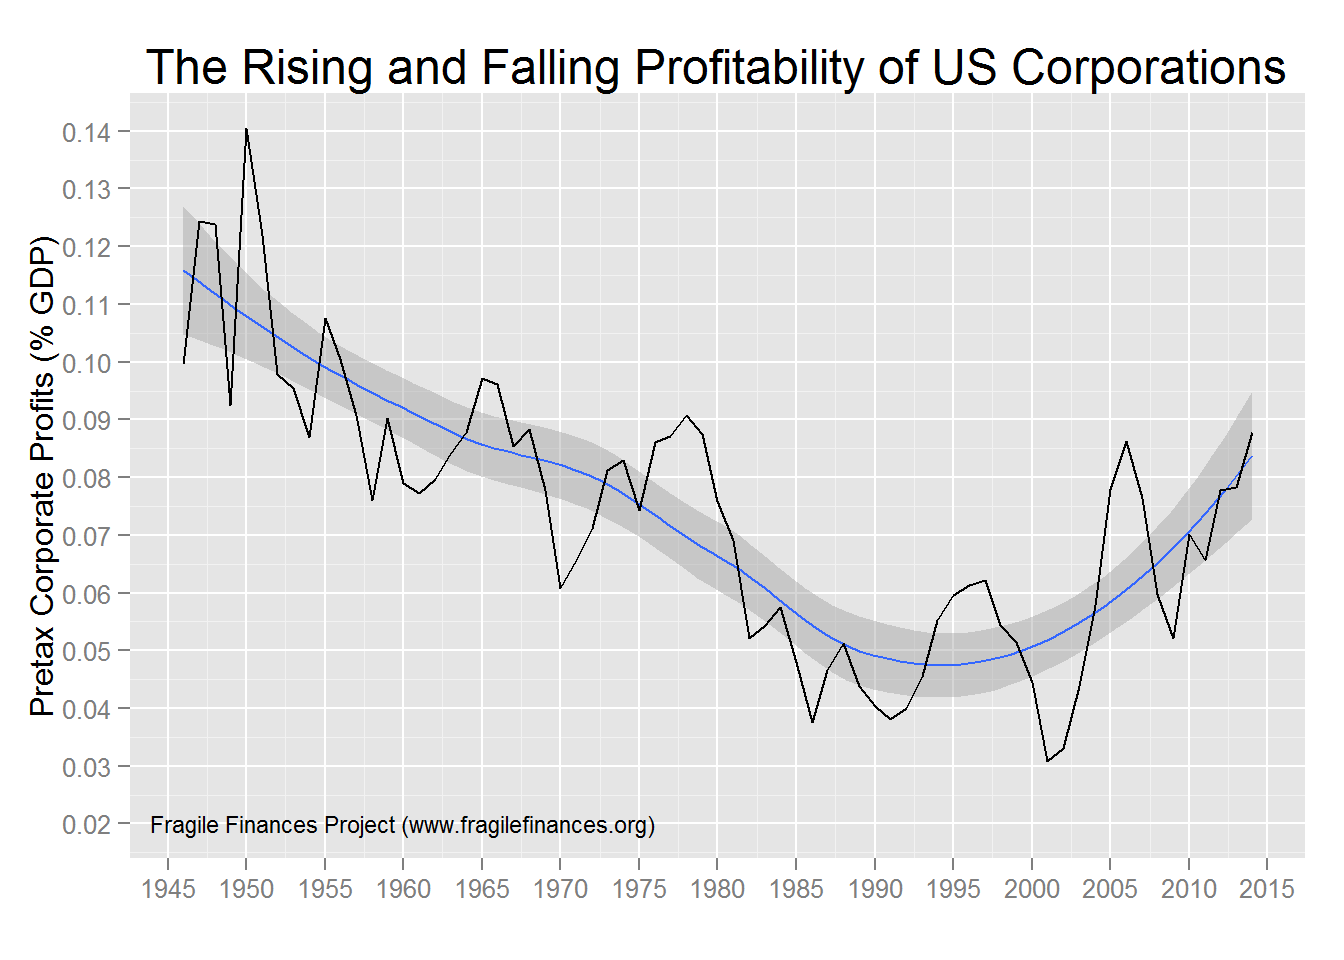
By looking at the relationship between Corporate Profits and GDP over a long period of time, in this case around 70 years, it is possible to conclude that corporate profits are at quite low levels compared to some times in the past, and were at a very low point around the year 2,000. The problem is that the components of GDP have been changing very significantly over time and the role of labor and equipment (process) has changed dramatically.
There was a time when profits were constrained by production which was constrained by labor.
In recent years customers and technology are more critical drivers of profit.
The profit return on tangible assets in recent years has reached very high levels to the benefit of financial capital.
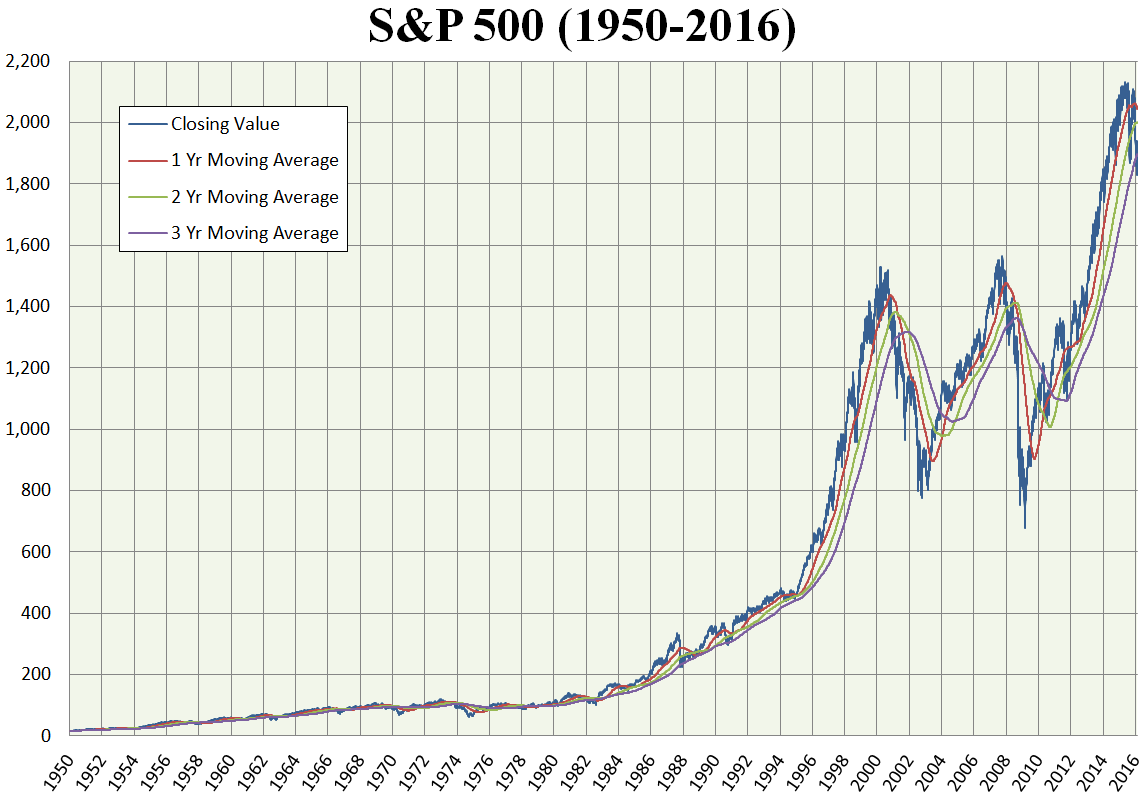
Corporate profit performance is the key driver of stock market performance, and the global news media monitors tracks the performance of many companies that are quoted on the world's stock exchanges. This information moves markets and is of importance to investors.
In the last decade high frequency trading has become widespread. This is NOT investing, but a way of gaming the market for profit. There is a need for some speculators in a stock market in order to give a market liquidity and flexibility, but when a market is dominated by speculators the market gets distorted and loses the resilience that is essential to economic stability.
|
STOCK MARKET PERFORMANCE
The global news media monitors the performance of every major stock market on the planet all day every day. It reports routinely in the business media several times an hour, and to the general public whenever there are substantial movements up or down.
But this information is really only of significant interest to investors ... but rather few people are significant investors whose lives are changed very much by the movement of the stock markets.
This measure of socio-enviro-economic performance is of interest to big investors, but for working people it is often the case that as the market goes up their work opportunities have gone down!
This chart of the S&P500 index of stock prices on the New York Stock Exchange from 1950 to 2016 shows how investors have profited mightily for almost 70 years
|
DISTRIBUTION OF INVESTMENT BENEFITS
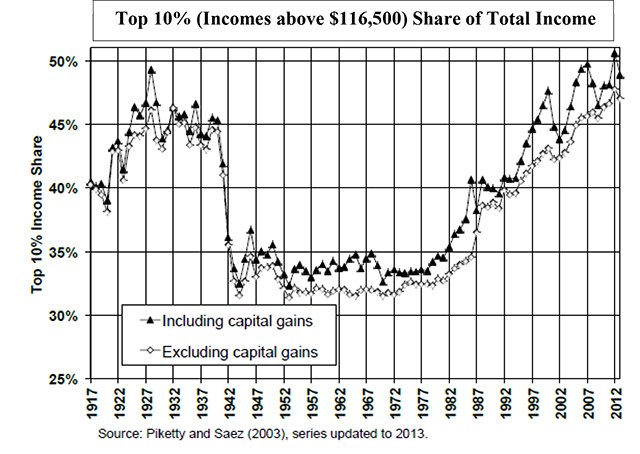
This charts shows how invetsment benefits have flowed to the top 10% over the past 100 years from 1917 to 2017. For the period up to WWII the share going to the top 10% was around 45%, but then dropped to a little under 35% until 1980. Since 1980 the share has increased rapidly and has been more than 45% again for the 15+ years since 2000.
In the United States, the period from WWII to around 1970 was a period of important socio-economic progress, with a large proportion of the labor force getting significanlty better pay and working conditions. This progress stalled in the 1970s in large part because of the OPEC oil shock and was then aggravated by policy options of the Reagan administration which continue to this day.
|
MONEY IS A TERRIBLE MEASURE
A good measure does not change over time, or because of conditions like temperature and humidity, or anything else. But money changes all the time for reasons as unreasonable as the perception of the public!
A money should not be able to be manipulated, yet money is designed to be managed (or manipulated) by those who are in control and responsible for money.
Essentially money is NOT a measure!
When it is used as a measure, then everything is distorted.
|
Existential Risk ... Climate Change
Though the issues are understood by scientists ...
critical decision makers and the general public do not!
|
Sea level rise from 1992 to 2015

Though the metrics have scientific validity ... they don't communicate anything about the impact
Measuring sea level rise in millimetres (mm) has the right amount of scientific rigor, but it does not resonate with either the general public or decision makers.
What does this rise mean?
What, for example, is the cost of protection that will be needed to avoid damage from periodic ocean storm surges.
How much damage was done in the North-East of the United States as a result of Super Storm Sandy? Was Super Storm Sandy aggravated by sea level rise, was it simply a event caused by global warming and increased climate instability.
Many of these questions are impossible to answers with a high degree of certainty because these are simple questions about a very complex set of systems. But what is possible and useful is to estimate the cost of the required protection and the cost of damage incurred when the required protection is missing.
These estimates of cost will not be precise, but the order of magnitude will help to put decision making in context.
AND these costs will escalate over time rather than becoming less ... discounting future costs the way discounting future profits results in a net present value (NPV) does NOT produce a net present cost!
|
|
