
Date: 2026-03-03 Page is: DBtxt003.php txt00021655
PRODUCT ... CRUDE OIL
PRODUCTION BY REGION
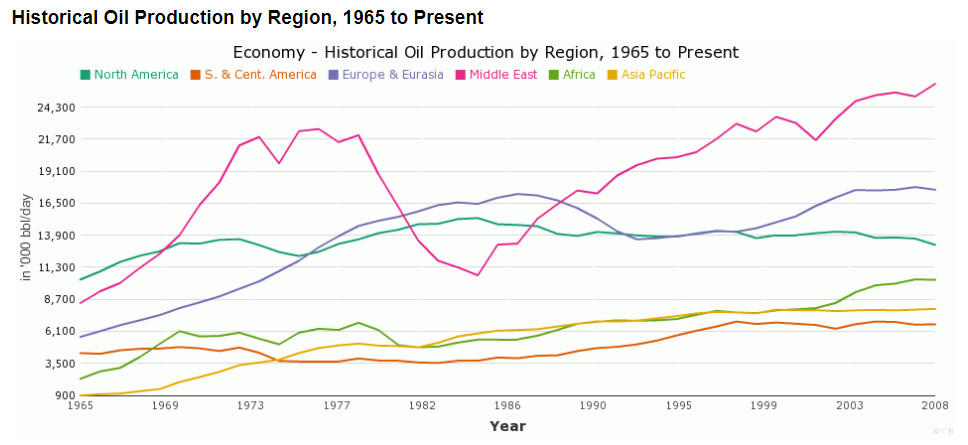
Chart of Global Oil Production by region by year - 1965 to 2009
PRODUCTION BY REGION
Chart of Global Oil Production by region by year - 1965 to 2009
Original article: http://chartsbin.com/view/wyw
Burgess COMMENTARY
There have been major changes in the pattern of production of crude oil over the past 70 years.
During the 1960s it was the Middle East that grew in importance becoming the dominant producing area. In 1973 the Organization of Petroleum Exporting Countries (OPEC) formed a cartel to control international prices and forced the market to accede to their goals by curtailing the growth of their production during the 1970s and then dramatically curtailing production at the end of the 1970s.
Prices prior to 1973 were around $3.50 a barrel and with the formation of OPEC these jumped to around $13.50 a barrel. By the end of the 1970s the price had increased to around $30.00 a barrel as Middle East oil production was curtailed. For a short period the price went as high as $120.00 a barrel.
From a production low around in the early 1980s the Middle East production has grown and prices have been relatively stable in the range of around $35 to around $60 a barrel sometimes peaking briefly to higher levels.
North American production has been relatively stable growing modestly over the past 60 years. During this time North American production has changed from being very low cost to a much higher cost as more difficult resources had to be exploited to maintain production.
Production in Europe and Eurasis increased substntially from around 1966 to 1990. Much of this was associated with the development of offshore oil fields in the North Sea off Great Britain, the Netherlands and Norway.
Peter Burgess
List of countries included in each region:
- North America includes United States,Canada and Mexico.
- South. & Cent. America includes Argentina, Brazil, Colombia, Ecuador, Peru, Trinidad and Tobago, Venezuela and Other S. & Cent. America.
- Europe & Eurasia inclucdes Azerbaijan, Denmark, Italy, Kazakhstan, Norway, Romania, Russia, Turkmenistan, United Kingdom, Uzbekistan and Other Europe & Eurasia.
- Middle East inclucdes Iran, Iraq, Kuwait, Oman, Qatar, Saudi Arabia, Syria, United Arab Emirates, Yemen and Other Middle East.
- Africa includes Algeria, Angola, Cameroon, Chad, Congo, Republic of the, Egypt, Equatorial Guinea, Gabon, Libya, Nigeria, Sudan, Tunisia and Other Africa.
- Asia Pacific includes Australia, Brunei, China, India, Indonesia, Malaysia, Thailand, Vietnam and Other Asia Pacific.