
Date: 2026-03-07 Page is: DBtxt003.php txt00021654
PRODUCT ... CRUDE OIL
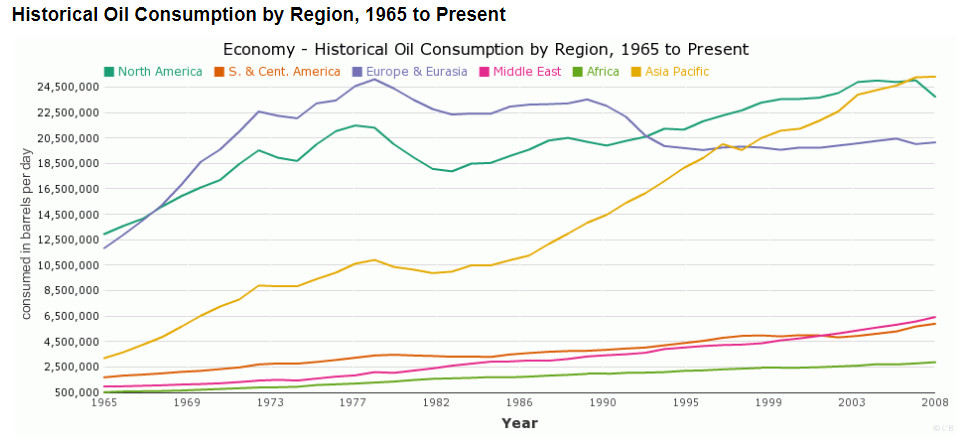
CONSUMPTION BY REGION
Chart of daily Global Oil Consumption by region by year - 1965 to 2009
CONSUMPTION BY REGION
Chart of daily Global Oil Consumption by region by year - 1965 to 2009
Original article: http://chartsbin.com/view/oc2
Burgess COMMENTARY
This chart was prepared in 2010 .. but little has changed from then until now (2022)
Most regions of the world have had relatively stable levels of energy consumption since the 1970s with the exception of the Asian Region.
This suggests that it is the Asian Region, and specifically China that has the most responsibility for GHG pollution and global warming. But this is not the whole story. Most of the production in the Asian Region and in particular China are exported for consumption in North America (specifically the United States) and Europe.
Without consumption there is no production. The essential driver of pollution has been consumption in North America and Europe more than the production in Asia.
When production migrated from North America, and to a lesser extent Europe. the relationship between production and pollution deteriorated while the profit potential dramatically improved. Since the advent of financialization and many modern management optimization practices, everything has been about optimizing for profit and it should come as no surprise that the Asian Region (mainly China) has had impressive growth in production. They have become the dominant supplier to the world in many product lines.
Peter Burgess