
Date: 2026-03-04 Page is: DBtxt003.php txt00021653
PRICES
CRUDE OIL
Price track from 1861 to 2009
CRUDE OIL
Price track from 1861 to 2009
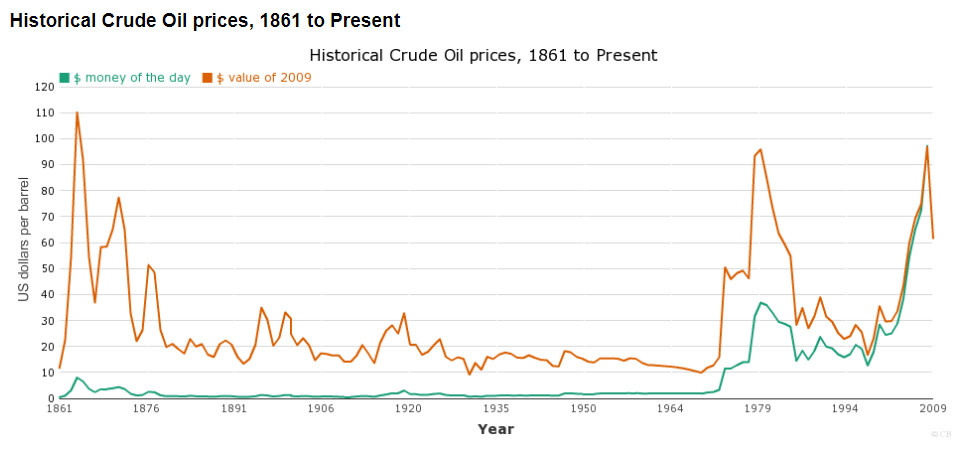
Bottom line is $ money of the day / Top line is $ value of 2009
Original article: http://chartsbin.com/view/oau
Burgess COMMENTARY
This chart was prepared in 2009
I am an old cost accountant and know something about the behavior of costs in a variety of situations. There are many oil-fields around the world that are able to produce oil at a very low cost. These fields were profitable when the price of oil was $3.50 a barrel. They are a lot ... a huge lot ... more profitable when the price of oil is $30.00 a barrel and up.
There are also areas where the cost of extracting crude oil is a lot more.
The various operations in the North Sea were costing more like $13.00 a barrel when the OPEC oil shock happened in 1973. If OPEC had never happened the offshore oil industry in places like the North Sea would have failed. I believe this is one of the reasons that the OPEC cartel was able to be successful ... it was doing exacly what a number of countries (like the UK and the Netherlands, and later Norway) needed to happen.
The rise in price for crude oil also was a huge bonanza for the major established oil companies who were producers all over the world with existing facilities. Their costs for this production did not go up, but the prices for selling the products from this production went through the roof ... as did their profits. They have never looked back.
Peter Burgess
Bottom line is $ money of the day / Top line is $ value of 2009
Note:
- 1861-1944 US Average.
- 1945-1983 Arabian Light posted at Ras Tanura.
- 1984-2009 Brent dated