
Date: 2026-03-15 Page is: DBtxt003.php txt00014396
Energy / Germany
Renewables up / Carbon base stable
What “transition” are the Germans up to exactly?
Burgess COMMENTARY
Peter Burgess
What “transition” are the Germans up to exactly?
350 billion euros, which is more than the cost of rebuilding from scratch all the French nuclear power plants, is what Germany has invested from 1996 to 2014 to increase by 22% the fraction of renewable electricity into the gross production of the country (that went from 4% to 27%). For this price tag our neighbors did not decrease their energy imports, did not accelerate the decrease of their CO2 emissions per capita, that remain 80% higher to those of a French, increased the stress on the European grid (which is not less useful when electricity production is “decentralized”, all the opposite), and it is debatable whether it allowed to create industrial champions and jobs by millions. If net exports are taken into account – they rose from zero to an average 6% of the annual production, and mostly happen when the wind blows or the sun shines – the fraction of renewable electricity in the domestic consumption is probably closer to 20%. Analysis below.
Seen from France, our German neighbors definitely have all virtues: their public spending is under control, their exports are at the highest, the unemployement low, and on top of that housing affordable and mid-sized companies thriving like nowhere else. With such a series of accomplishments, why on Earth should we act differently from them on any subject? And, in particular, when it comes to energy, the French press is generally eager to underline that they have chosen the right path, when we remain blinded by our radioactive foolishness.
As usual, facts and figures may fit with the mainstream opinion in the paper… or not. In order to allow the reader to conclude his way, I have gathered below some figures that are published by bodies that are neither antinuclear nor pronuclear, neither anti-renewables nor pro-renewables, but only in charge of counting electrons depending on where they have been generated. Let’s start!
Where do the German electrons come from?
Anyone saying that German electricity is more and more renewable will indeed answer correctly. Without any doubt, renewable electricity increases in Germany.
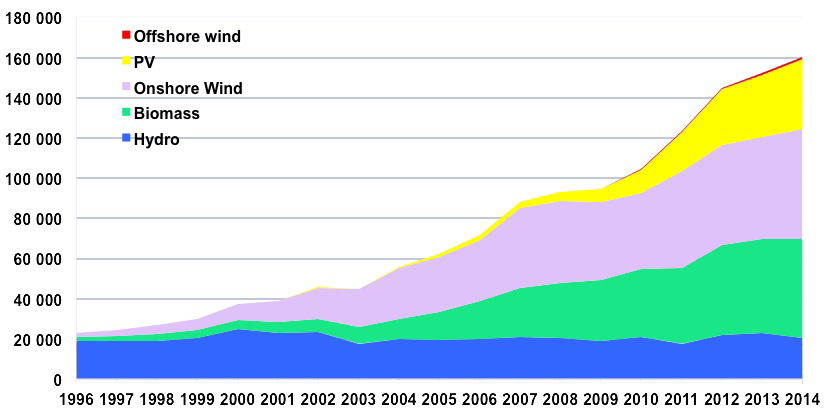
German electricity generation coming from renewable sources since 1996, in GWh
(1 GWh = 1 million kWh ; the electricity consumption of Germany is roughly 600 billion kWh – hence 600.000 GWh – per year).
In 12 years (1996 to 2012) the renewable production has been multiplied by 7.
Data from AGEE-Stat, Federal Ministry of Environment, Germany.
From there, anyone will conclude that if renewables increase, the rest decreases. True again!
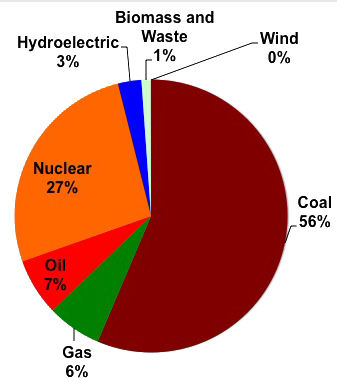
Breakdown of German electricity generation in 1991.
Renewables amount to 4% of the total, with 3% for hydroelectricity (which amounts to 12% in France).
Data from TSP data portal TSP data portal
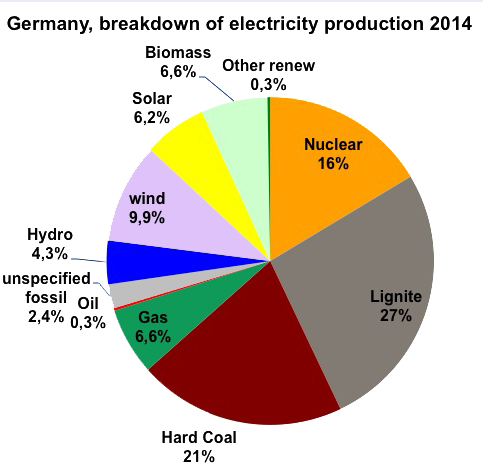
Breakdown of German electricity generation in 2014.
Renewables now amount to over 27% of the total, but only half of them is composed of intermittent modes (solar and wind).
Data from ENTSOE
But there is something else that is obvious when looking at the graphs above: in 2011 as in 1991, most of the electricity generation comes from fossil fuels, coal (including lignite) being the first primary energy used, and, furthermore, the amount of kWh coming from coal, oil and gas is about the same today as what it was 20 years ago. If the name of the game is to decrease CO2 emissions, then no significant progress has been made in two decades.
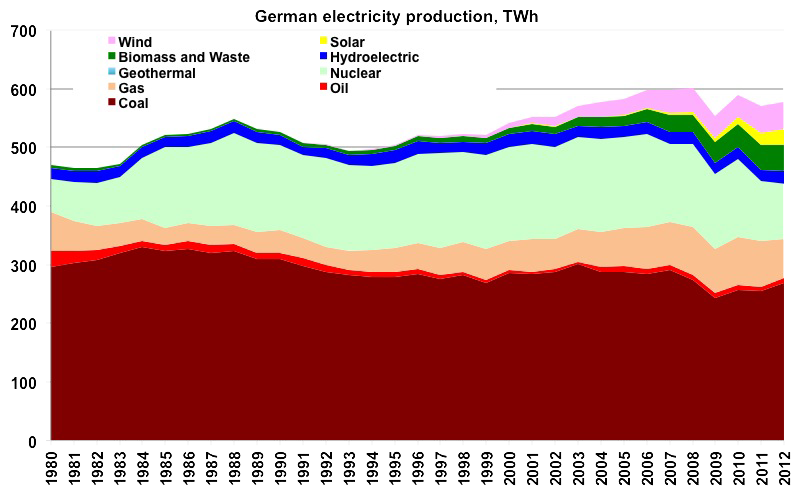
Breakdown of the German electricity generation from 1980 to 2012.
One will easily see that the total coming from fossil fuels (coal, oil and gas) is roughly constant over the period, with a little less coal, a little more gas, and almost no oil anymore.
One will also notice that nuclear has begun to decrease in 2006 (thus before Fukushima), and that the “new renewables” (biomass, solar and wind) increase came on top of the rest until 2006.
Data from TSP data portal
A zoom at the monthly production for the last years (since 2005) confirms the rise of the “new renewables” (biomass, wind, solar) in a total that remains globally unchanged. Something else which is clearly visible is that fossil fuels account for the dominant share in the winter increase (France is thus not the only country with an increased consumption in winter).
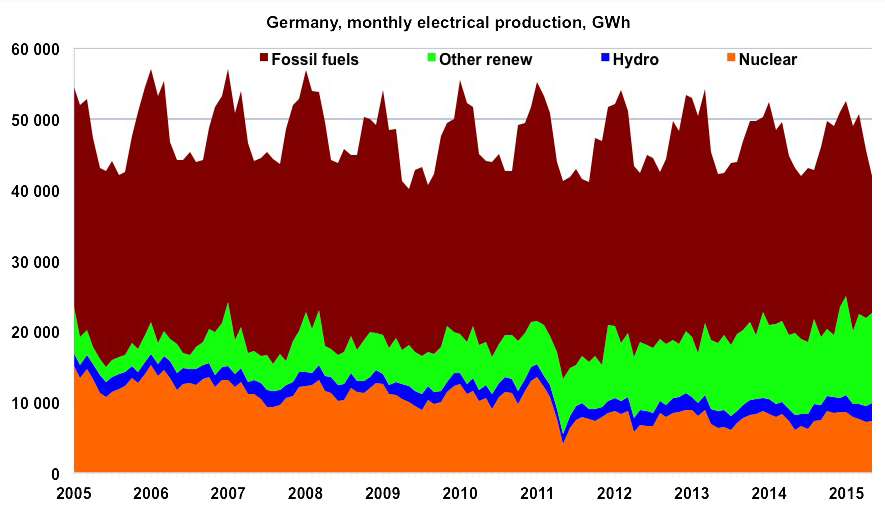
Monthly electricity production in Germany from January 2005 to May 2015, with a breakdown showing fossil fuels (oil, gas and most of all coal), nuclear, hydroelectricity, and “new renewables” (all renewables except hydro).
The sharp decrease of nuclear after Fukushima (March 2011) is clear, but a close look indicates that shortly after it came back to its historical trend, that is a slow decline that begun in 2006.
Data from ENTSOE
What is absolutely certain is therefore that renewable electricity has significantly increased in Germany, and that’s definitely what is focusing the attention of the French press. But… the available data indicates that before 2006 this renewable supply came on top of the rest (with no impact on CO2 emissions), and after 2006 they mostly substituted nuclear (with no more decrease of the CO2 emissions!).
If that is so, then the overall “non fossil” generation (nuclear and renewables alltogether) must be about stable. And it is indeed what is happening!
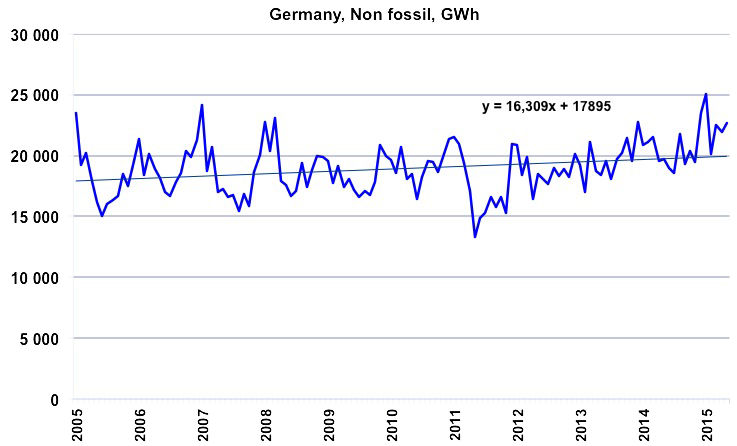
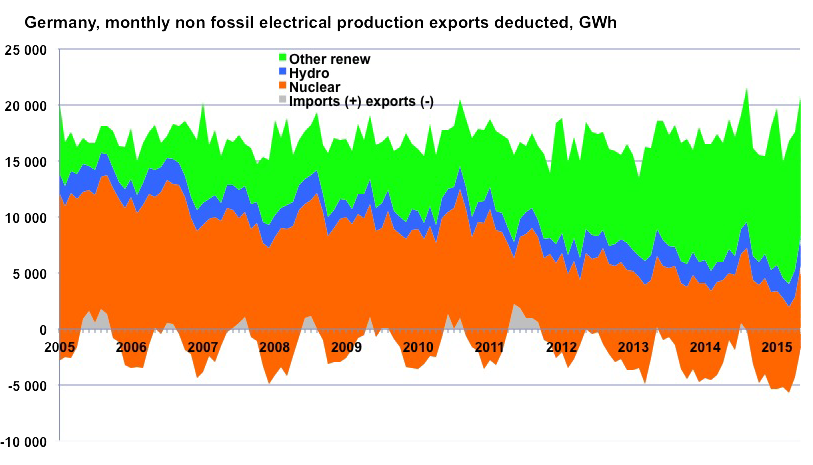
Historical monthly “non fossil” electricity generation in Germany from January 2005 to May 2015, in GWh.
This production totals renewables (including hydro) and nuclear. The trend is almost flat, and we will see below that the increase of the last two years is almost fully exported.
Author’s calculations on primary data from ENTSOE
As the global production is otherwise almost stable, it means that the share of “non fossil” must be about constant (on average), which is confirmed by figures.
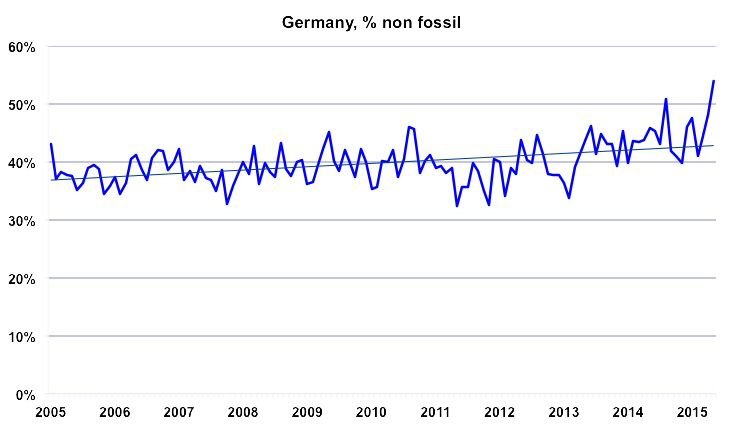
Monthly share of “non fossil” electricity generation in Germany from January 2005 to May 2015.
Author’s calculations on primary data from ENTSOE
Another element that confirms that renewables substitute nuclear, and not fossil fuels, is to observe the historical energy imports of Germany and France (which has far less renewables in its electricity generation, but far more nuclear).
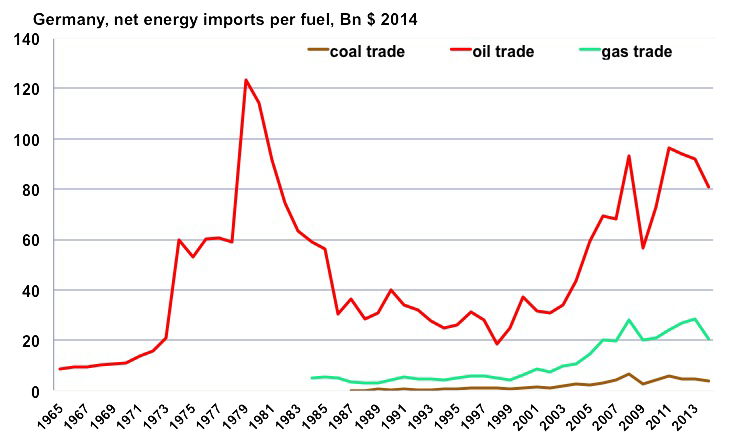
Reconstitution of German imports by energy, in billion constant dollars since 1981.
There is no obvious difference with France (below): the trends are exactely the same for oil and gas, and the amounts of the same magnitude. One will notice that Germany imports coal (almost 50% of its consumption).
Author’s calculations on primary data from BP Statistical Review, 2015
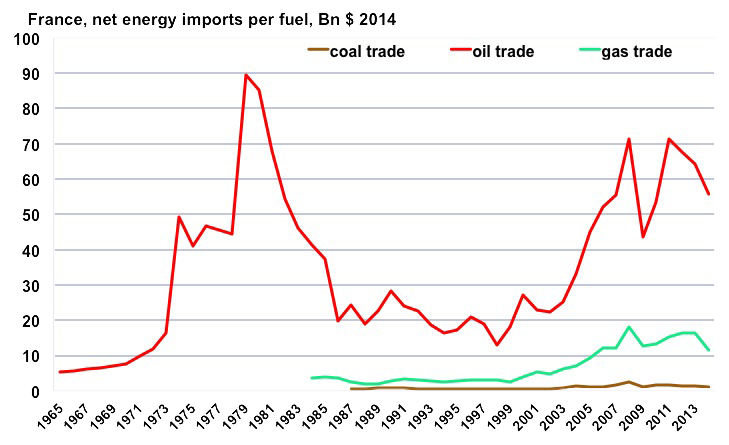
Energy imports in France, in billion constant dollars since 1981.
It resembles a lot to Germany!
Author’s calculations on primary data from BP Statistical Review, 2015
One might argue that we should also take into account the exports associated with domestic industries in renewable energies: wind turbines, solar panels, or biogas production units. But… for solar panels Germany is a heavy importer, as Europe. We have imported for more than 110 billion dollars of imported solar cells from 2008 to 2014, and Germany accounted for almost half of the total. For wind turbines China is also becoming a tough competitor on the international market. It is not clear whether the cumulated exports have outbalanced by far the cumulated imports!
What about money?
Another hot topic regarding the German “transition” is its cost. First, let’s recall that the “transition”, for the time being, is a change for 22% of the electricity production (but Germans also use oil products, gas and coal – the latter for their industry). Discussing money allows for a number of possibilities, and the first item that is discussed here is investments. These are absolutely indispensable to increase capacities, and one thing is sure: capacities have increased!
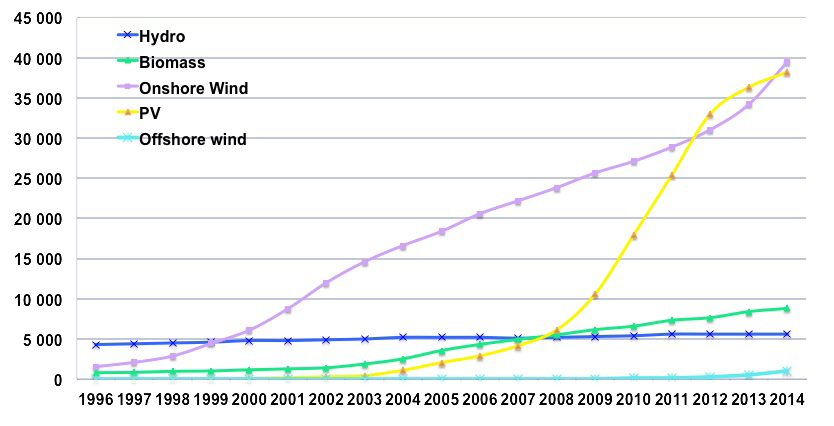
Installed capacities for various renewable modes in Germany since 1996, in MW.
The total amounts to 93.000 MW, or 93 GW.
Source: AGEE-Stat, Federal Ministry of Environment, Germany.
Germans therefore had 93 GW (or 93 000 MW) of installed capacities for renewable electricity at the end of 2014, that is more than the French installed capacity in nuclear power plants, that will amount to 65 GW when Flamanville is completed. One might therefore conclude that Germany produces more renewable electricity than France nuclear. Actually, it is not the case: Germany produced roughly 160 TWh (160 billion kWh) of renewable electricity in 2014, when the French nuclear output was about 3 times more. The reason is that the load factor for the new renewable capacities in Germany is between 60% and 10%, when for nuclear the values are rather between 70% and 80%. Furthermore, the german load factor (for renewables) is rapidly decreasing for the moment.
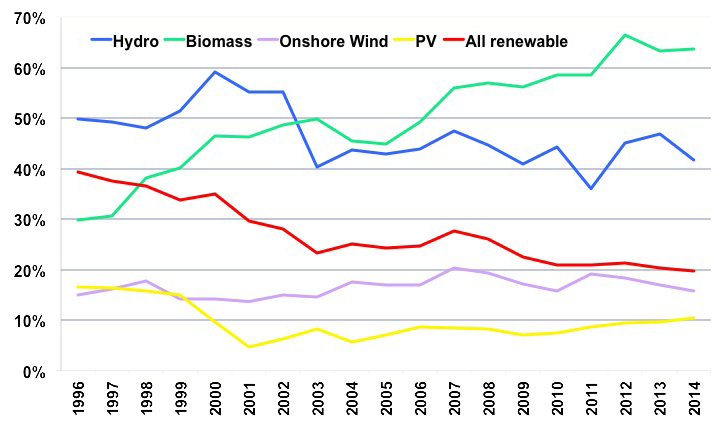
Load factor for each renewable capacity in Germany.
This factor corresponds to the fraction of the year during which the capacity shoud operate at full load to produce what it really produces in a year.
For example, if this factor is 20%, it means that the annual output would be obtained with the capacity operating at full load during 20% of the year, and nothing the rest of the time. What really happens, of course, is that during the year the output of a given installation constantly varies between zero and full load, and when an average is done over a large number of installations and a long time (one year), then we get this famous load factor.
The higher it is, and the more electricity you get out of a given capacity.
The curve “total” gives the average factor for all renewable capacities in Germany. It has been divided by 2 since 1996, because solar (which contribued a lot to new capacities) has a much lower load factor than any other renewable capacity.
Author’s calculations on primary data from (BP Statistical Review, European Wind Association, AGEE Stat).
As a consequence, to produce as much as 8 GW of nuclear (one third of the German capacity) with a 80% or 90% load factor, it is necessary to have – in Germany – 40 GW of wind turbines, that have a load factor below 20% (as low as 14% for bad years), and even more if losses due to storage are taken into account. With photovoltaic, 65 GW are necssary (without losses due to storage). In both cases, it is more than what has already been installed in Germany.
To get all these new capacities, investments are necessary. They are required for the sources themselves (wind turbines, solar panels, etc), but also elsewhere in the electricity sector to “absorb” these new sources: connections, reinforcements, grid management, etc.
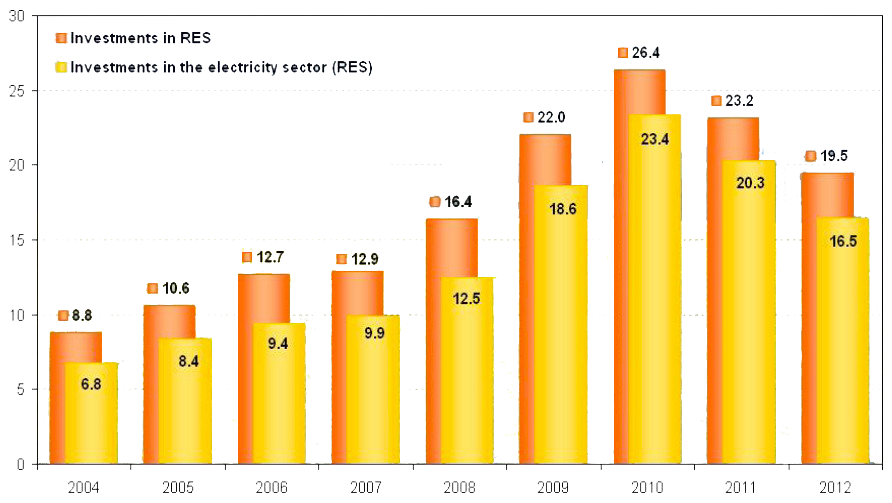
Billion euros invested yearly into renewable sources in Germany (orange), and billion euros invested yearly into the electricity sector in Germany (yellow) since 2004.
The cumulated amount represents more than 250 billion euros.
Knowing that the investments in renewables sources above include heat, that has no impact on the electricity sector, one might accept the simple conclusion that for one euro invested into a renewable source, it is necessary to add one euro elsewhere in the electricity sector to get the whole thing running.
Source : AGEE Stat, Federal Ministry of Environment, Germany.
If we make the a additional hypothesis that unitary costs for solar, wind and biomass decrease by respectively 5%, 2% and 2% per year, and if we accept that for the period pre-2004 it was also necessary to put one euro into the electric system “elsewhere” when one euro was invested into a new capacity, then Germany has already invested more than 300 billion euros into its “transition”.
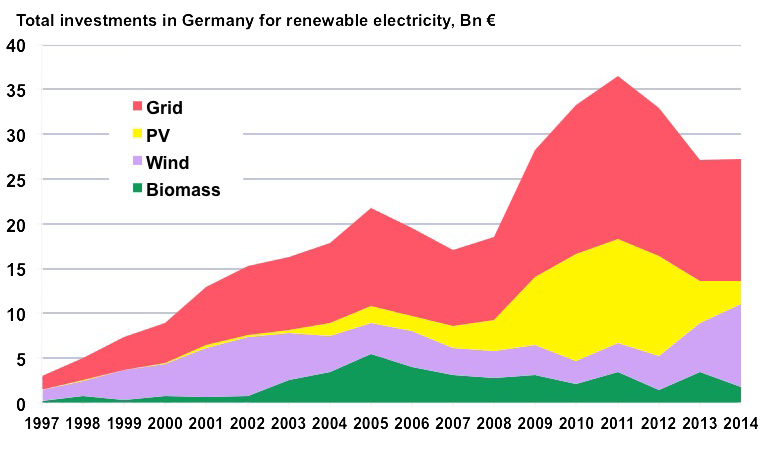
Yearly investments, in billion euros, that Germany has made into adding new renewable capacities.
These amounts include both the sources (solar panels, wind turbines) and the rest of the electric system (grid). This amount does not include the amounts, far less important, invested into renewable heat.
Author’s calculations on primary data from BP Statistical Review, European Wind Association, AGEE Stat.
If Germany was to turn to renewables all its present electricity production, it should “convert” an additional 320 TWh, or 2 times what has already been done. If we assume that the unitary costs of the investments in the grid required to absorb new capacities do not increase with the installed capacity of intermittent sources (when it is probably the case), that the unitary cost of wind turbines and solar panels is not bound to be divided by something significant anymore (among other reasons, we might suggest that the production of turbines or panels will increasingly suffer from the growing scarcity of raw materials, that will apply here as elsewhere), and that the share of each mode remains the same, then we need to build, for the additionnal gross production:
90 GW of wind turbines,
120 GW of solar
20 GW of biomass
Which requires 750 billion euros, grid included. But then, to backup intermittence with no more coal and gas power plants (and no possibility to rely on the “dirty” plants of the neighboring countries!), such a system would require a storage capacity of 100 to 200 GW (such as pumping stations), when Germany has only 4 so far, for an investment of 500 to 1000 billion euros, for example with new dams in the German Alps, and plenty of pipes to carry water up and down from the Baltic Sea (with batteries the investment would be even higher and the lifetime much shorter). As such a way to store electricity generates losses of 30% of the incoming electricity (the yield of a pumping station is 75%, and transporting electricity from the turbines to the storage and vice-versa adds 5% at least), it means that the installed capacity has to be increased by 20% to 40% – depending on the share used without storage – for an additionnal 250 billion euros, grid included.
The total bill should therefore amount to something close to a year of GDP, that is over 2000 billion euros. Furthermore, assuming biomass units keep the same load factor and have a yield between 30% and 45% (smaller units have a smaller yield), that any land devoted to biomass production can produce 5 tonnes oil equivalent per year of raw energy, then 20% to 25% of the country (8 to 10 million hectares) would be devoted to biomass production for electricity generation. Easier said than done!
If we try to summarize, at this point we can conclude that:
From 1996 to 2014, Germany has increased by 140 billion kWh (or 140 TWh) its renewable electricity, and in this total:
a little more than 60 TWh is an increase of electricity production (which contradicts the idea sometimes put forward that “when everyone has a solar panel on his roof and a wind turbine in the field next door, then the population becomes conscious of the true value of electricity and uses less”), that will mostly be exported at “sacrified” prices since the global consumption is decreasing,
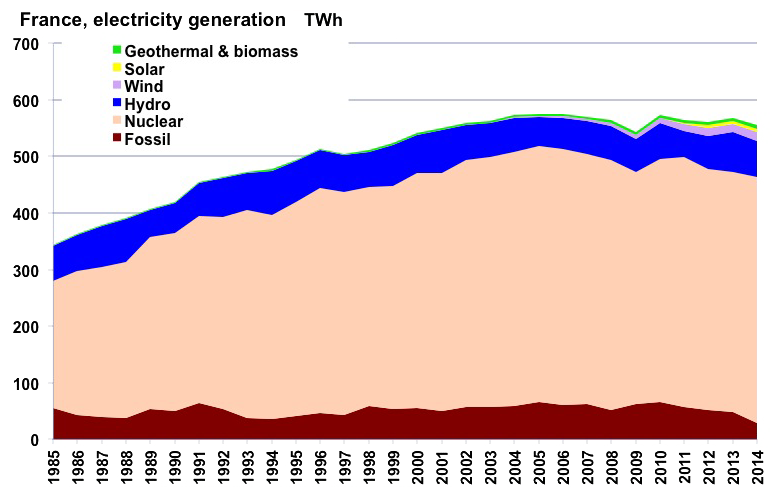
Electricity generation in France since 1985, in billion kWh.
From 1995 to 2014 it increased by 12%.
Source BP Statistical Review, 2015
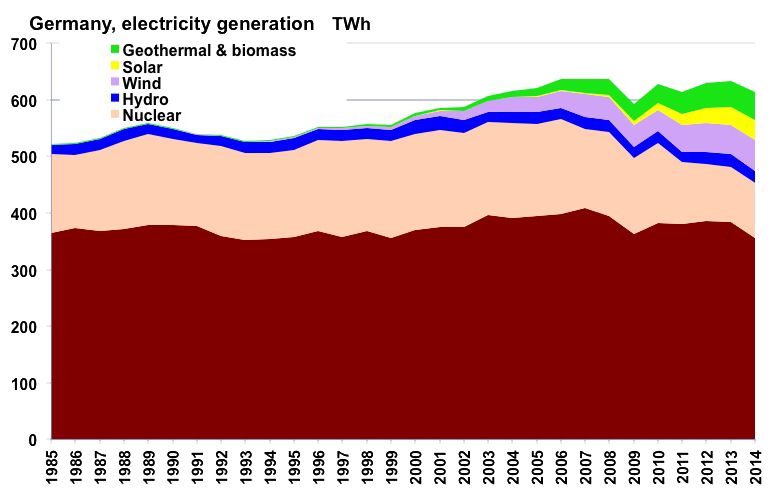
Electricity generation in Germany since 1985, in billion kWh.
From 1995 to 2014 it increased by 14% (a little more than in France). Besides the global aspect is very similar (the stability during the 80’s and the early 90’s is the reflect of the reunification, because of the poor efficiency of former East Germany).
Source: BP Statistical Review, 2015
Roughly 60 TWh has been used to partially offset nuclear, that decreased from 160 to 100 TWh,
Fossil fuels decreased by only 12 TWh, which is not significant over the period (the change of the shares of gas and coal in the total fossil is not linked to the penetration of renewables),
Germany has invested 350 billion euros (over 10% of its annual GDP), and should multiply this amount by 7 at least to become 100% renewable in electricity. This investment should be repeated for a large part in 25 year, that is the lifetime of wind turbines or solar panels (nuclear power plants last 60 to 80 years). Over 60 years, a “100% renewable electricity” plan would therefore require 15 to 30 times more capital than producing the same electricity with nuclear power plants (not accounting for the cost of capital).
This “transition”, so far, had had no discernable impact on the energy trade balance. Becoming fully renewable for electricity will avoid gas imports for electricity generation (now amounting to 160 TWh per year, or 16 billion cubic meters, for roughly 4 billion euros), but no more, since oil (which represents by far the dominant part) is almost absent from electricity generation, and coal is mostly domestic,
This “transition”, so far, had had no effects on CO2 emissions, and to have one it will be necessary to phase out coal, when, for the time being, our German friends are planning to add more capacities (and lignite production has been increasing for several years),
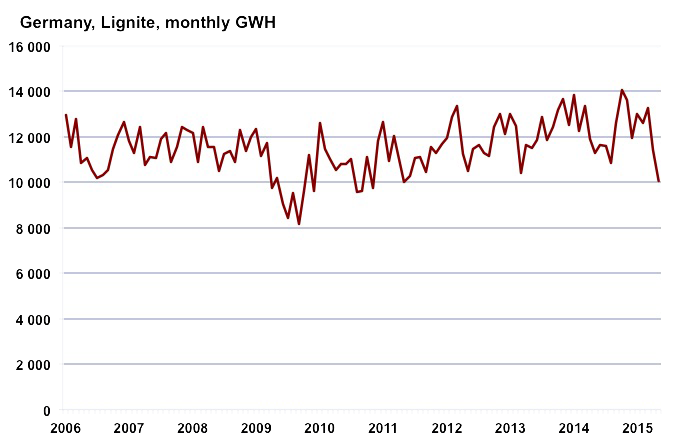
Monthly electricity generation coming from lignite in Germany since 2006, in GWh.
Not really going down!
Source: ENTSOE
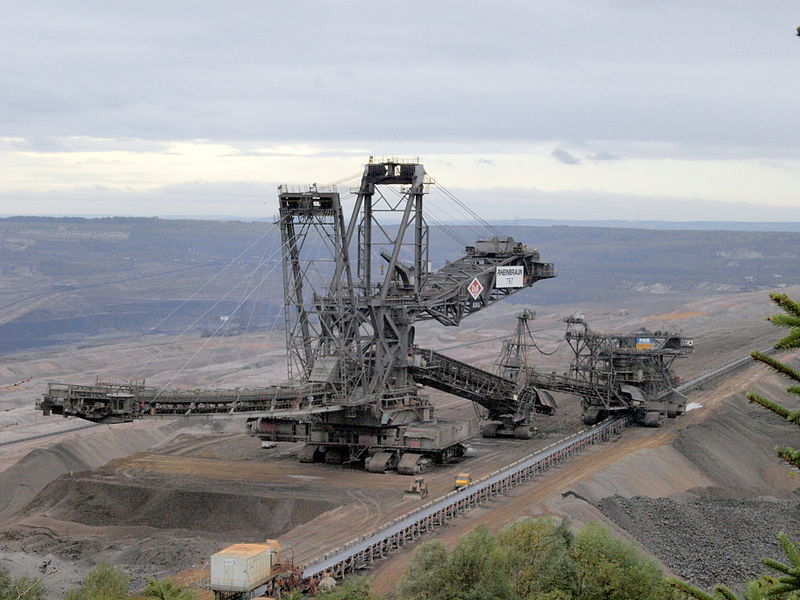
Let’s recall that lignite, apart from CO2 emissions, is produced from open pit mines, that lead to a complete destruction of the environment over tens of square kilometers, heaps of ashes, water pollution, population displacement, etc, and that lignite power plants are no more virtuous than nuclear ones regarding heat losses.
A lignite mine in Germany, with a digging machine at the center of the picture. The size of the bulldozer, at the bottom of the excavator, gives an idea of the size of the digging machine! And besides the landscape is not precisely environmentally friendly… Photo: Alf van Beem, Wikipedia Commons
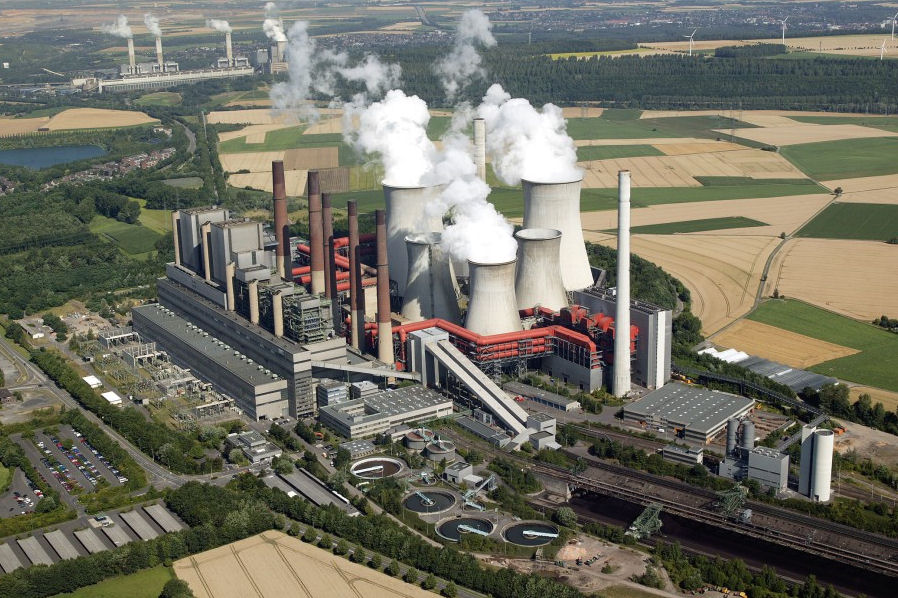
A lignite power plant in Germany (Neurath; roughly 4000 MW of installed capacity).
The difference with a nuclear power plant is not that obvious! The “answer” is in the presence of chimneys (to evacuate fumes), that do not exist for nuclear power plants, in a water treatment plant (not necessary with nuclear), and in the train terminal used to carry lignite (50 000 tonnes per day at full capacity, when a nuclear power plant of the same power will use 20 kg of uranium only).
and, at last, it is absolutely certain that some jobs have been created, but if we offset those that have been destroyed elsewhere, because the end consumer cannot spend his money twice, the total is most certainly below the numbers boasted by the German government (which, like all governments, counts what is created in the sector sustained, but cautiously avoids to look at the perverse effects that might happen elsewhere for the same reason!).
Let’s now take a lookat what happened for the end consumer. The amount per kWh has indeed increased, but not only because of renewables. Gas and coal also played a role, because the price of the fuel represents 50% to 70% of the full production cost with coal and gas fired power plants.
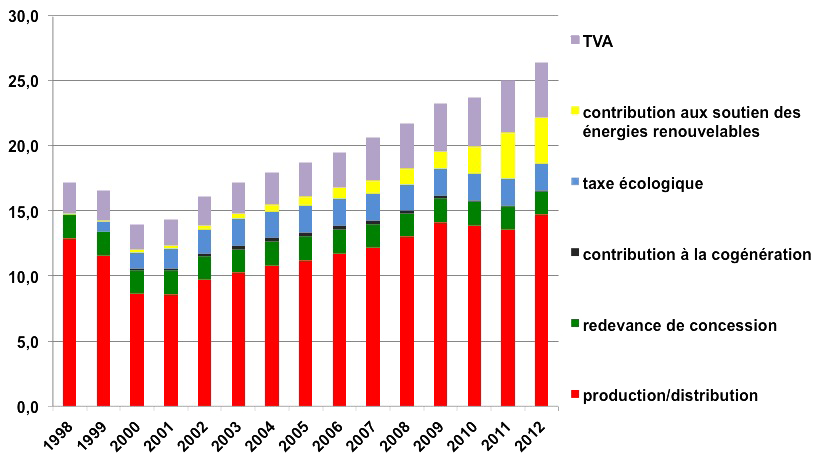
Price per kWh for the individual cosumer in Germany, 1998 to 2012.
The increase is clear, but the main contributor is “production+distribution”, which includes transportation costs, but also the purchasing price of fossil fuels used with coal and gas power plants. One will notice that the red bar increases during the 2000-2009 period, when the price of imported gas and coal rises fast, and decreases when the price of imported gas and coal decrease (2009-2011).
Source : BDEW
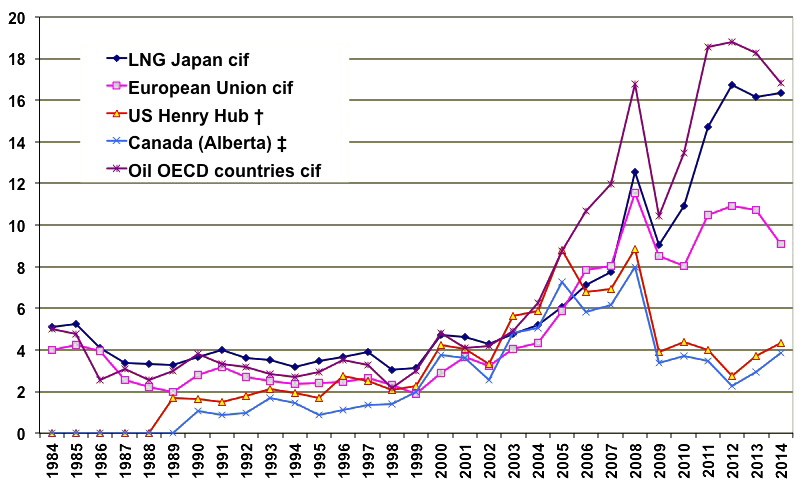
Spot prices of gas in several regions of the world (Henry Hub relates to the US) and of oil, all expressed in dollars per million British Thermal Unit
(1 million BTU ≈ 0,3 MWh).
CIF means Charged Insurance and Freight, that is the full cost with transportation and insurance.
The price of gas in Europe evolves just as the red bar in the previous graph over the period 2000 – 2012.
Source: BP Statistical Review, 2015
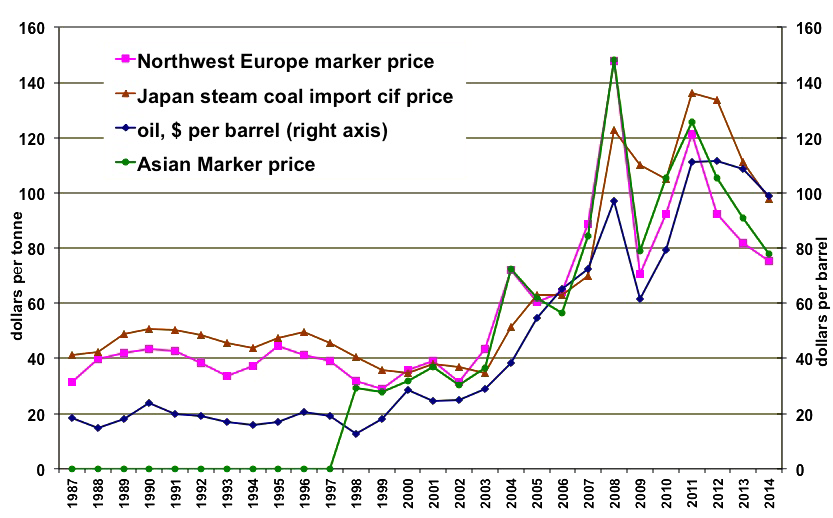
Spot prices of coal in several regions of the world.
Over the period 2000 – 2012, the price of coal in Europe has also evolved as the red bar in the graph giving the price per electrical kWh for the end consumer.
Source: BP Statistical Review, 2015
We might now suggest an additional conclusion: if electricity prices have increased for the individual, it is not only because of renewables, but because there remains an important fraction coming from fossil fuels!
Where do the German electrons go?
That’s a funny question: if Germans produce electricity, it is to use it, ins’t it? Well, that partially true, but also partially false. European countries are interconnected, and electricity can go from one country to another. Statistics show that imports and exports have greatly increased at the borders of Germany lately.
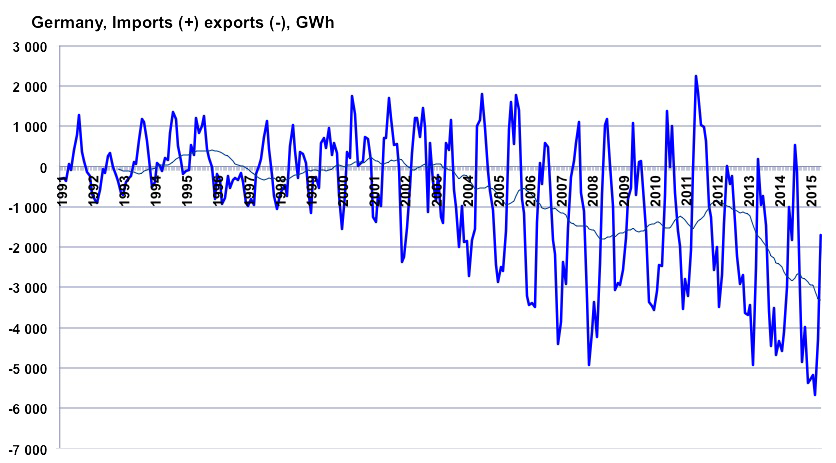
Monthly balance of electricity echanges (with the rest of Europe) at the border of Germany, in GWh.
One will easily notice that the magnitude increases until 2007, and remains at the same level since then. Besides, Germans used to export little amounts before 2005, and now export more, mainly in the winter.
Data from ENTSOE
As the above graph shows, exports mostly take place in the winter (and imports in the spring). It happens that it is also in the winter that there is more wind, as the graph below shows.
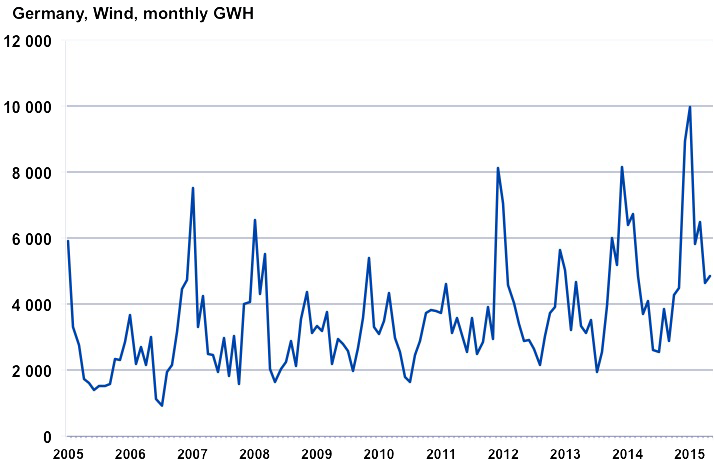
Monthly wind production in GWh from January 2005.
The output is highly variable depending on the year, but it always happens in December of January.
Data from ENTSOE
It is therefore normal ro wonder wether there is not a link between wind and exports. And it might well be the case!
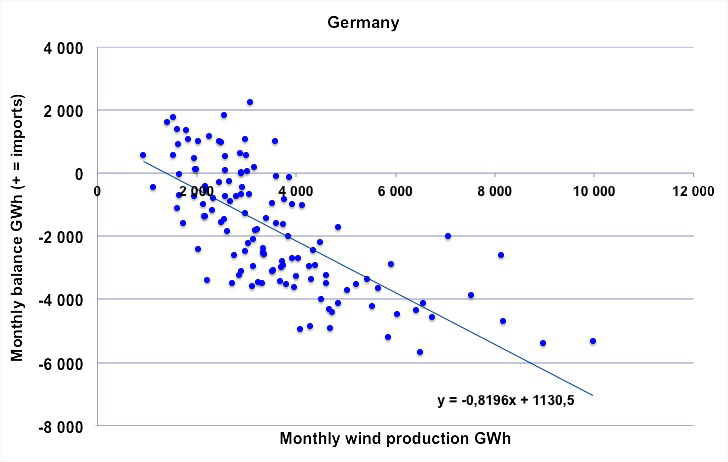
Monthly exchanges (vertical axis, positive values mean net imports and negative ones net exports) depending on the monthly wind production in Germany, from January 2005 to May 2015.
The dots clearly show that when wind production increases, exports also increase. It suggests that increased exports are directely or indirectely linked to an increase in wind production.
Author’s calculations on primary data from ENTSOE
If exports have increased along with the increase of the amount of renewable electricity produced, then it might be instructive to look at the fraction of “non fossil electricity” that remains in Germany once deducted the exports that appeared since the beginning of the EnergieWende.
Non fossil electricity (renewable+nuclear) once additional exports (since the beginning of the EnergieWende) are deducted.
Surprise: what remains for Germany is about constant for the last 10 years. In other words, the fraction of renewables that dies not replace nuclear is exported (and does not replace any fossil production, which is consistent with what is mentionned above).
Author’s calculations on data from ENTSOE
And, in accordance with the correlation between renewables and exports, a last effect generated by the 10% of electricity coming from wind is that the spot price of electricity decreases when wind increases.
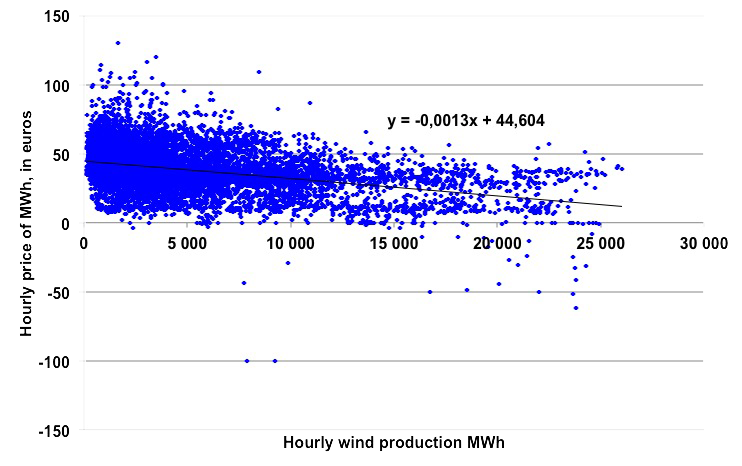
Hourly spot price of electricity on the German market depending on the hourly wind production for 2013.
Obviously, the more wind there is, the lower the price is, with the apparition of nil or even negative prices over 10 GWh per hour. As there was roughly 30 GW of installed capacity in Germany in 2013, it means that when one third of wind turbines operate at fiull power, nil or negative prices appear (and then the producer pays the consumer to take the electricity, because the cost of stopping everything is even higher).
When there is no price the average price is 50 euros per MWh, and when the installed capacity is operating at almost full power (24 GW) the average price per MWh falls below 20 euros.
Data from pfbach.dk
If we come back to the initial question, our dear neighbors certainly do something that is meaningful for them, but what they do not do for certain is trying to phase out fossil fuels as fast as possible. A simple reminder of the emissions per capita on each side of the Rhine will show that the “good guys” are not necessarily where the press finds them!
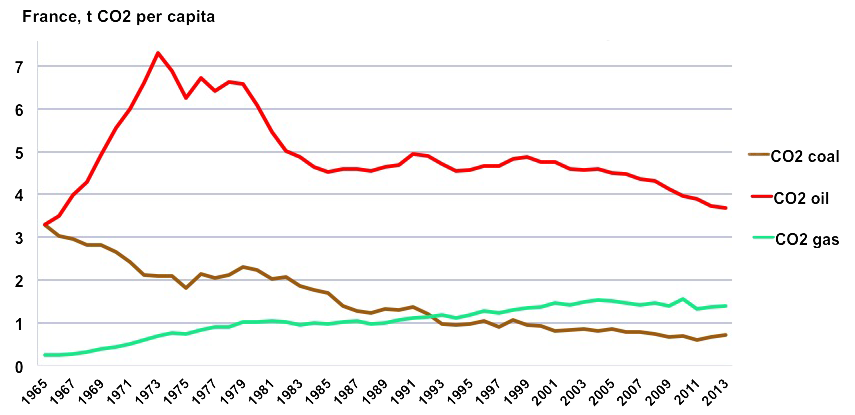
Per capita CO2 emissions coming from fuel combustion in France, from 1965 onwards (in tonnes).
Coal contributes for a little below 1 tonne per person and per year (4 times less than in 1965), gas for about 1,5 tonne, and oil for 4 tonnes, for a total of roughly 6 tonnes in 2014.
Author’s calculations on data from BP Statistical Review, 2015
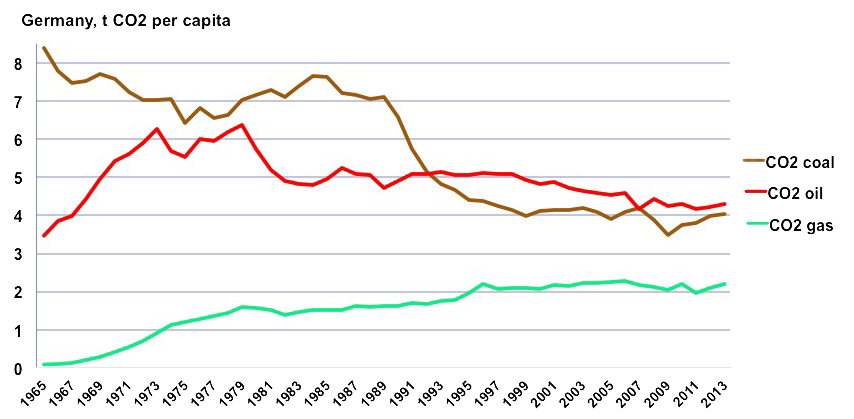
Per capita CO2 emissions coming from fuel combustion in Germany, from 1965 onwards (in tonnes).
Oil contributes a little more than in France, but gas is 50% higher, and coal 5 times higher, for a total of over 10 tonnes.
Since 1980 he evolution for oil is very similar to what it is for France, but the “transition” is still to come regarding coal and gas… and obviously the “EnergieWende” didn’t have any kind of “CO2 avoided” effect that is often boasted in governmental or even academic publications.
Author’s calculations on data from BP Statistical Review, 2015
Of course, one can only wish that our Germans friends do succeed, in a short delay, to get rid of fossil fuels. But, on the ground of the available data, a preliminary conclusion is that it has not been their objective for the last 15 years. If they eventually succeed to get rid of fossil fuels in the 10 to 20 years to come, and if the population is ready to pay 10 times more (that is 3000 billion euros instead of 300) to avoid the inconvenients of nuclear, real or supposed, there is nothing to object. It is a respectable choice, only it is not the only one which is possible!
But if the Germans where to stop in midstream, that is with renewables that have substituted only nuclear, without influencing the consumption of fossil fuels, then they will have spent their money on something else than the European objective (phasing out fossil fuels), and lost a precious time, which is the most serious damage in the present case, as Europe is running against time regarding its energy supply.
SOCIETAL CHOICES
Published on May 1, 2013
Last Modified on August 1, 2015
Cover Image:
Alf van Beem (Wikipedia)