
Date: 2026-04-22 Page is: DBtxt003.php txt00013446
Energy / Hyrdrocarbon Production
Drilling Rig Data
Mark Nibbelink co-founder of Drillinginfo. ... RIG COUNT DATA – SO MUCH MORE THAN A NUMBER ... Latest techniques much lower cost and higher production!
Burgess COMMENTARY
Peter Burgess
RIG COUNT DATA – SO MUCH MORE THAN A NUMBER

Rig Count Data – So Much More Than a Number
Ever since oil and gas prices started tanking in late 2014-early 2015, just about anyone with a stake in upstream or midstream oil and gas indulged in that very Yogi Berra-esque “deja-vu-all-over-again” exercise of paying very close attention to rig count data.
Rig counts down? Crap, no one’s drilling, the industry is falling apart!
Rig counts increasing? Hallelujah, everyone’s figured out how to break-even, or even profit at $50 oil!
So rig count has become the “leading indicator” proxy for where the industry thinks it’s headed on the profitability front.
However, if we step back a bit, and ask some questions, we should begin to realize that rig counts do NOT tell us the whole story.
For example if rig activity increases are always interpreted as expectations of improving margins, we need to turn a blind eye to DUCS. Sure, drilling to hold but not complete secures acreage for a while, but it sure as hell isn’t contributing revenue to anyone’s bottom line.
Here’s our mapping of them—by our count there are 6298 DUCS in the lower 48.
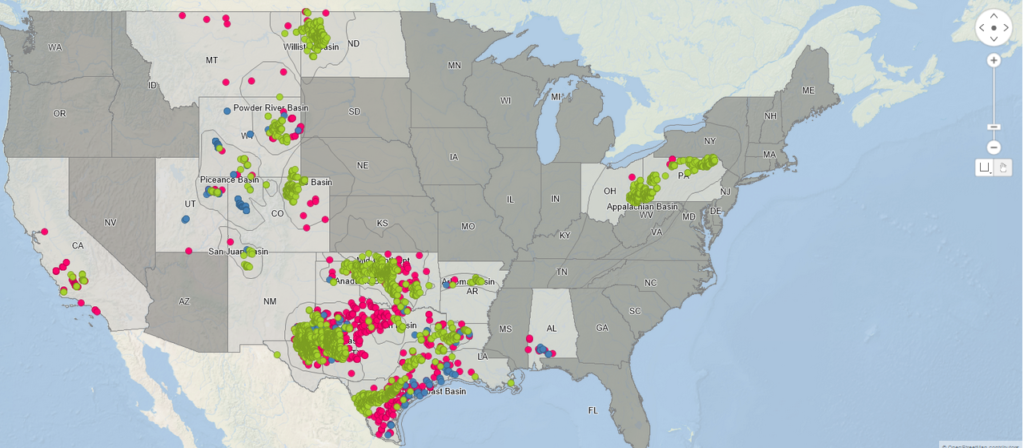
DUCS in the lower United States
So we need to recognize that while increasing rig counts are wonderful metrics for the drilling industry, gains in rigs don’t always imply gains in reserve base or gains for the completion side of oil field services.
Even if every well in the active rig count was making hole to TD, and was expected to be completed, we all know that there’s a world of difference in time on location and money spent on a deep 20,000’ horizontal well as opposed to a 4500’ Wilcox well.
That deep horizontal provides better margins to drilling contractors and other oilfield service companies, provides better( or at least longer lasting paychecks to everyone on the rig floor/location), and most likely puts more NPV on the books.
However, if that deep horizontal is drilled in an area with less than stellar infrastructure, AFE costs, operating costs, and wellhead prices work against improving margins.
At $90 oil, Bakken(purple) rig counts trailed only the Midland Basin (light green) and the Eagleford (pink) ,but when prices hit their lowest points the cutback in Bakken drilling far outpaced the reduction in the Midland Basin or Eagleford plays.
 is way better than where we were a year ago(yellow)…[shown by state].
<br><br>
<img src = )
rig count chart
But if we look at where we were 3 years ago(red), the tale of the tape tells us we still have a long road to recovery.
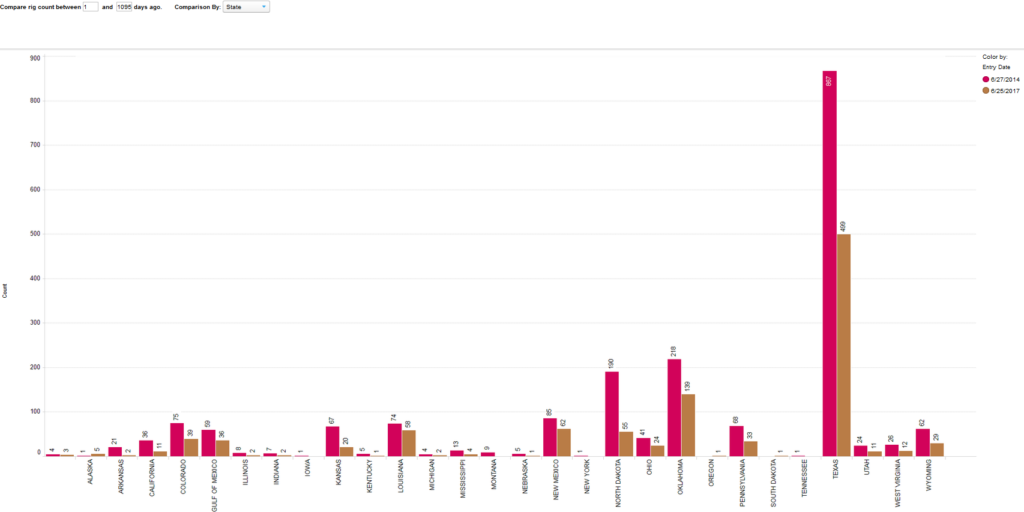
rig count recovery
Any indicators that the industry has caught its breath and found its way forward are welcome news, and provide solace to hard-hit oil field service companies.
But let’s be sure to look behind simple rig counts at the associated data to gauge how –and where–these numbers are improving the industry.
We have to look closely at the granddaddy assumption that most analysts make—that we have to return to the level of rig activity/counts that we had at the height of the recent boom years to pronounce upstream E&P “healthy”.
The graph of Max Month Gas production below for the Marcellus clearly shows that year over year Max Month rates have been climbing. So much so, in fact, that 2017 results are better than 2014 results by nearly 75%
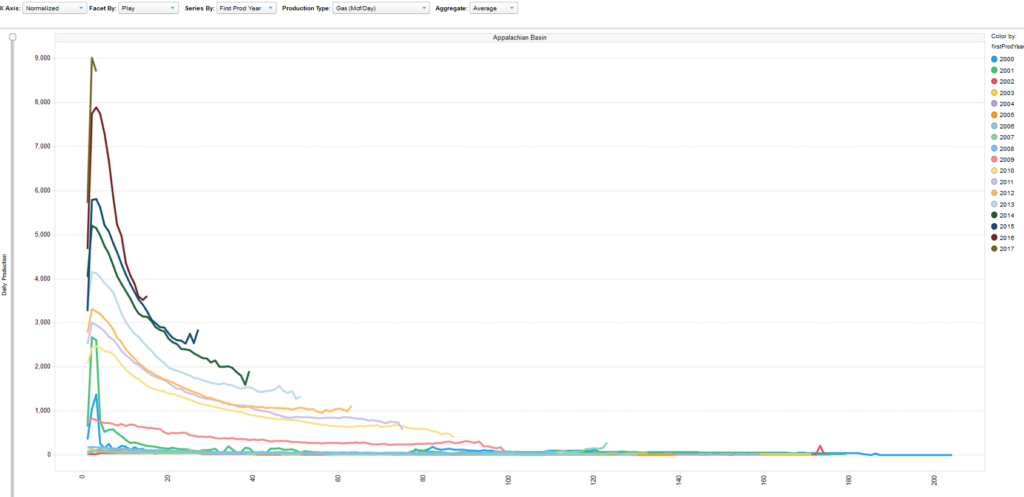
max monthly gas production
And yearly cumulative production graphs indicate that 2016 cumulative gas production addition rates nearly matched cumulative gas additions from 2014 boom year production.
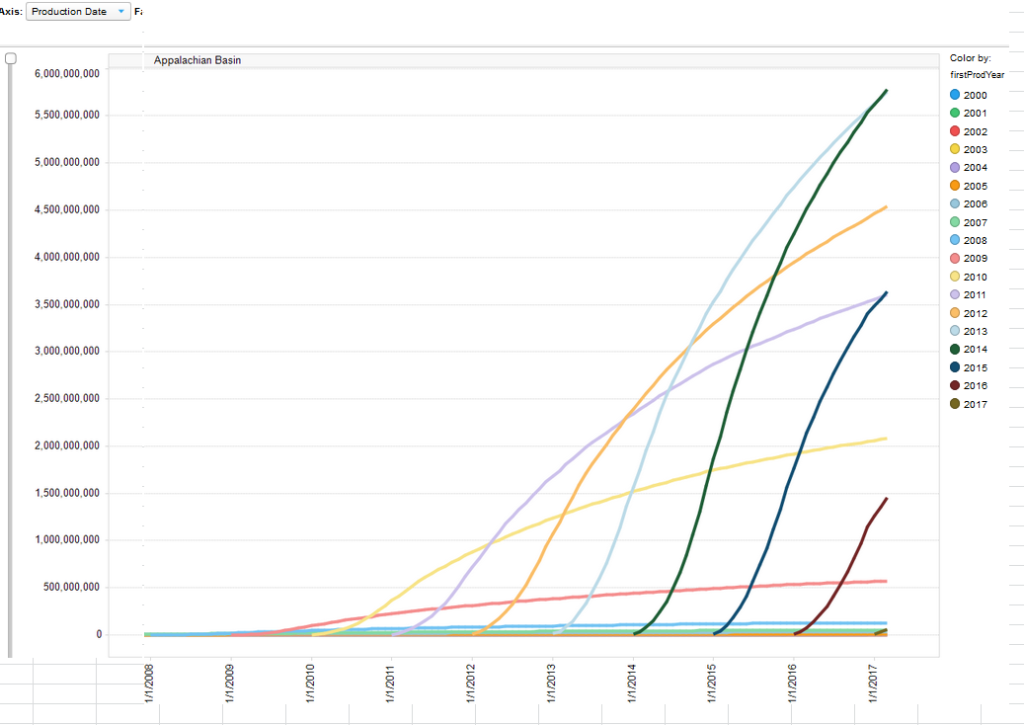
cumulative production charts
If in fact operators are doing a better job of extracting their hydrocarbons , are starting their production flows at Max Month flow rates that are nearly 2X what they were in boom times, and are doing it with rig counts that are 40% below 2014 levels, then maybe we all can relax a bit around the rig count metrics that we all follow.
===============================================================================
MARK NIBBELINK
Mark Nibbelink co-founder of Drillinginfo. He currently works with Universities, Colleges and Consortia to broaden the depth and reach of Drillinginfo’s platform for the students who are the future of the Oil & Gas industry. He received his Bachelor of Arts in Geology and Master of Arts in Geology and Geophysics from Dartmouth College.
Our Related Post
--------------------------------------------------------------------------------
Beyond the Rig Count: Visualizing Patterns of Rig Activity
The STACK, The SCOOP and Oklahoma Oil & Gas
Are Rig Counts Dead?