
Date: 2026-03-13 Page is: DBtxt003.php txt00005910
Burgess COMMENTARY
Peter Burgess
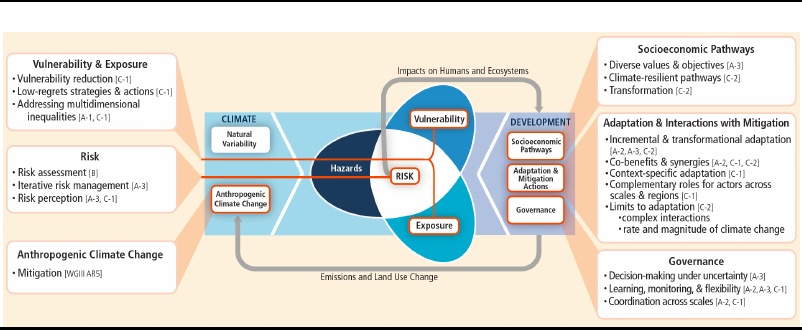
P. 4[LEAKED DRAFT*] IPCC: Change 2014: Impacts, Adaptation, and Vulnerability [LEAKED DRAFT*] IPCC: Change 2014: Impacts, Adaptation, and Vulnerability Ratings: 0|Views: 16,981|Likes: 0 Published by Jon Queally [LEAKED DRAFT*] IPCC: Change 2014: Impacts, Adaptation, and Vulnerability [work in progress] See More FINAL DRAFT (FGD) IPCC WGII AR5 Summary for Policymakers Do Not Cite, Quote, or Distribute 2 28 October 2013 INTRODUCTION 1 2 Human interference with the climate system is occurring, 1 and climate change poses risks for human and natural 3 systems (Figure SPM.1). The assessment of impacts, adaptation, and vulnerability in the Working Group II 4 contribution to the IPCC’s Fifth Assessment Report (WGII AR5) evaluates how patterns of risks and potential 5 benefits are shifting due to climate change and how risks can be reduced through mitigation and adaptation. 6 7 Compared to past WGII reports, the WGII AR5 assesses a substantially larger knowledge base of relevant scientific, 8 technical, and socioeconomic literature. Increased literature from all regions has facilitated comprehensive 9 assessment across a broader set of topics and sectors, with expanded treatment of human systems, adaptation, and 10 the ocean. [1.1, Figure 1-1] 11 12 Section A of this summary characterizes observed impacts, vulnerability and exposure, and responses to date. 13 Section B examines the range of future risks and potential benefits. Section C considers principles for effective 14 adaptation and the broader interactions among adaptation, mitigation, and sustainable development. Box SPM.1 15 defines central concepts, and Box SPM.2 introduces terms used to convey the degree of certainty in key findings. 16 Chapter references in square brackets and in footnotes indicate support for findings, paragraphs of findings, figures, 17 and tables in this summary. 18 19 Figure SPM.1: Climate-related hazards, exposure, and vulnerability interact to produce risk. Changes in both the 20 climate system (left) and development processes including adaptation and mitigation (right) are drivers of hazards, 21 exposure, and vulnerability. [19.2, Figure 19-1] 22 23 **Boxes SPM.1 and SPM.2 are included at the end of the SPM text.** 24 25
A) IMPACTS, VULNERABILITY, AND ADAPTATION IN A COMPLEX AND CHANGING WORLD 26 27 A-1. Observed Impacts, Vulnerability, and Exposure 28 29 Observed impacts of climate change are widespread and consequential. Recent changes in climate have caused 30 impacts on natural and human systems on all continents and across the oceans. 2 Evidence of climate change impacts 31 is strongest and most comprehensive for natural systems, although some impacts in human systems have also been 32 attributed to climate change. See Figure SPM.2 for a summary of observed impacts and indicators of a changing 33 climate, illustrating broader trends presented in this section. 3 34 35 Figure SPM.2: Widespread indicators of a changing climate. (A) Global patterns of observed climate change 36 impacts, at regional, subregional, and more local scales. For categories of attributed impacts, symbols indicate 37 affected systems and sectors, the relative contribution of climate change (major or minor) to the observed change, 38 and confidence in attribution. (B) Glacier mass budgets from all published measurements for Himalayan glaciers, 39 also showing global average glacier mass budget estimates from WGI AR5 4.3 with shading indicating ±1 standard 40 deviation. The blue box for each Himalaya measurement has a height of ±1 standard deviation centered on its 41 average (and ±1 standard error for multi-annual measurements). Himalaya-wide measurement (red) was made by 42 satellite laser altimetry. (C) Locations of substantial drought- and heat-induced tree mortality around the globe over 43 1970-2011. (D) Average rates of change in distribution (km per decade) for marine taxonomic groups based on 44 observations over 1900-2010. Positive distribution changes are consistent with warming (moving into previously 45 cooler waters, generally poleward). The number of responses analyzed is given for each category. (E) Summary of 46 estimated impacts of observed climate changes on yields over 1960-2013 for four major crops in temperate and 47 tropical regions, with the number of data points analyzed given for each category. [Figures 3-3, 4-7, 7-2, 18-3, and 48 MB-2] 49 50 1 WGI AR5 2.2, 6.3, 10.3-6, 10.9 2 Attribution of observed impacts in the WGII AR5 links responses of natural and human systems to climate change, not to anthropogenic climate change, unless explicitly indicated. 3 18.1, 18.3-6 FINAL DRAFT (FGD) IPCC WGII AR5 Summary for Policymakers Do Not Cite, Quote, or Distribute 3 28 October 2013 In response to ongoing climate change, terrestrial and marine species have shifted their ranges, seasonal 1 activities, migration patterns, and abundance, and have demonstrated altered species interactions ( high 2 confidence ). Increased tree mortality, observed in many places worldwide, has been attributed to climate change in 3 some regions. While recent warming contributed to the extinction of many species of Central American amphibians 4 ( medium confidence ), most recent observed terrestrial-species extinctions have not been attributed to recent climate 5 change, despite some speculative efforts ( high confidence ). Natural climate change at rates much slower than current 6 anthropogenic change has led to significant ecosystem shifts, including species emergences and extinctions, in the 7 past millions of years. 4 8 9 In many regions, changing precipitation or melting snow and ice are altering hydrological systems, affecting water resources and quality (medium confidence). Glaciers continue to shrink in many regions due to climate 11 change (high confidence). Climate change has caused permafrost warming and thawing in high-latitude and high-12 elevation mountain regions. 13 14 Negative impacts of climate change on crop and terrestrial food production have been more common than positive impacts, which are evident in some high-latitude regions (high confidence) . Recent periods of rapid 16 food and cereal price increases have indicated that current markets in key producing regions are sensitive to climate 15,16 17 extremes. 18 19 In recent decades, climate change has likely contributed to human ill-health although the present world-wide 20 burden of ill-health from climate change is relatively small compared with effects of other stressors and is not 21 well quantified. There has been increased heat-related mortality and decreased cold-related mortality in some 22 regions as a result of warming (medium confidence). 23 24 Vulnerability and exposure 25 26 Differences in vulnerability and exposure arise from non-climatic stressors and multidimensional inequalities, 27 which shape differential risks from climate change (very high confidence). See Box SPM.3. 8 28 29 Impacts from recent extreme climatic events, such as heat waves, droughts, floods, and wildfires, demonstrate 30 significant vulnerability and exposure of some ecosystems and many human systems to climate variability 31 ( very high confidence ). These experiences are consistent with a significant adaptation deficit in developing and 32 developed countries for some sectors and regions. 9 33 34 Climate-related hazards constitute an additional burden to people living in poverty, acting as a threat 35 multiplier often with negative outcomes for livelihoods ( high confidence ). Climate-related hazards affect poor 36 people’s lives directly through impacts on livelihoods, such as reductions in crop yields or destruction of homes, and 37 indirectly through increased food prices and food insecurity. Limited positive observed impacts on poor people 38 include isolated cases of social asset accumulation, agricultural diversification, disaster preparedness, and collective 39 action. 10 40 41 Violent conflict strongly influences vulnerability to climate change impacts for people living in affected places 42 ( medium evidence, high agreement ). Large-scale violent conflict harms assets that facilitate adaptation, including 43 infrastructure, institutions, natural capital, social capital, and livelihood opportunities. 11 44 45 Box SPM.3. Multidimensional Inequality and Vulnerability to Climate Change 46 47 4 4.2-4, 5.3-5, 6.1, 6.3-5, 18.3, 18.5, 22.3, 24.4, 25.6, 28.2, 30.4-5, Boxes 4-2, 4-3, 25-3, CC-CR, and CC-MB 5 3.2, 4.3, 18.3, 18.5, 24.4, 26.2, 28.2, Tables 3-1 and 25-1, Figures 18-2 and 26-1 6 7.3, 18.4, 22.3, 24.4, 26.5, Figures 7-2, 7-3, and 7-7 7 11.4-6, 18.4, 22.3, 24.4, 25.8, 26.6, 28.2 8 8.2, 9.3, 12.2, 13.1-2, 14.1-3, 19.6, 26.8, Box CC-GC 9 3.2, 4.2-3, 8.1, 9.3, 10.7, 11.3, 11.7, 13.2, 14.1, 18.6, 22.3, 25.6-8, 26.6-7, 28.4, 30.5, 30.7, Tables 18-3 and 23-1, Figure 26-2, Boxes 4-3, 4-4, 25-5, 25-6, 25-8, and CC-CR 10 8.2-3, 9.3, 11.3, 13.1-3, 22.3, 24.4, 26.8 11 12.5, 19.4, 19.6 FINAL DRAFT (FGD) IPCC WGII AR5 Summary for Policymakers Do Not Cite, Quote, or Distribute 4 28 October 2013 People who are socially, economically, culturally, politically, institutionally, or otherwise marginalized are often 1 highly vulnerable to climate change and climate change responses ( medium evidence, high agreement ). This 2 heightened vulnerability is rarely due to a single cause. Rather, it is the product of intersecting social processes that 3 result in inequalities in socioeconomic status, income, and exposure, including, for example, discrimination on the 4 basis of gender, class, ethnicity, age, and (dis)ability. The full spectrum of these processes and their context-specific 5 interactions shape multidimensional vulnerability and differential capacities and opportunities of individuals, 6 households, and communities. 12 7 8 A-2. Adaptation Experience 9 10 Adaptive human responses can be motivated by observed and projected climate change impacts and by broader 11 vulnerability-reduction and development objectives. 12 13 Adaptation is already occurring and is becoming embedded in some planning processes ( high confidence ). 14 Engineered and technological adaptation options are the most commonly implemented adaptive responses. There is 15 increasing recognition of the value of ecosystem-based, institutional, and social measures, including provision of 16 social protection measures, and of linkages with disaster risk reduction. Selection of adaptation options continues to 17 emphasize incremental adjustments and co-benefits and is starting to emphasize flexibility and learning ( medium 18 evidence, medium agreement ). Most evaluations of adaptation have been restricted to impacts, vulnerability, and 19 adaptation planning, with very few assessing the processes of implementation or actual adaptation actions ( medium 20 evidence, high agreement ). 13 21 22 Governments at various scales are starting to develop adaptation plans and policies, and adaptation 23 experience is accumulating across regions ( high confidence ). 24 • In Africa, most national governments are initiating governance systems for adaptation, and in predominantly 25 isolated efforts, disaster risk management, adjustments in technologies and infrastructure, ecosystem-based 26 approaches, conservation agriculture, and livelihood diversification are reducing vulnerability. 14 27 • In Europe, adaptation policy has been developed across scales, with some adaptation planning integrated into 28 coastal and water management and into disaster risk management. 15 29 • In Asia, adaptation practices have sometimes provided livelihood benefits, and adaptation has been facilitated 30 through integrated water resource management. 16 31 • In Australasia, planning for sea-level rise and, in southern Australia, for reduced water availability is becoming 32 widely adopted, although implementation faces major constraints, especially for transformational responses at 33 local and community levels. 17 34 • In North America, governments are engaging in incremental adaptation assessment and planning, particularly 35 at the municipal level, with some proactive adaptation anticipating future impacts for longer-term investments 36 in energy and public infrastructure. 18 37 • In Central and South America, ecosystem-based adaptation including protected areas, conservation 38 agreements, and community management of natural areas is increasingly common, with benefits for 39 improvements in livelihoods and preservation of traditional cultures. 19 40 • In the Arctic, residents have a history of adapting to change, but the rate of climate change and complex inter-41 linkages with societal, economic, and political factors represent unprecedented challenges for northern 42 communities. 20 43 • In small islands, diverse physical and human attributes and their sensitivity to climate-related drivers have 44 been inconsistently integrated into adaptation planning. 21 45 46 12 8.1-2, 8.5, 9.3-4, 10.9, 11.1, 11.3-5, 12.2-5, 13.2-3, 14.6, 18.4, 19.6, 23.5, 25.8, 26.6, 26.8, 28.4, Box CC-GC 13 4.4, 5.5, 6.4, 8.3, 9.4, 11.7, 14.1, 14.3-4, 15.2-4, 17.2-3, 21.3, 21.5, 22.3-5, 23.7, 25.4, 26.8-9, 30.6, Boxes 25-1, 25-2, 25-9, and CC-EA 14 11.7, 22.4, Box CC-EA 15 11.7, 23.7, Box 23-3 16 11.7, 24.4 17 25.4, 25.10, Table 25-2, Boxes 25-1, 25-2, and 25-9 18 26.7-9 19 27.3 20 28.2, 28.4 21 Table 29-3, Figure 29-1 FINAL DRAFT (FGD) IPCC WGII AR5 Summary for Policymakers Do Not Cite, Quote, or Distribute 5 28 October 2013 A-3. The Decision-making Context 1 2 Responding to climate-related risks involves making decisions and taking actions in the face of continuing 3 uncertainty about the extent of climate change and the severity of impacts in a changing world, with potential 4 limits to the effectiveness of incremental approaches ( high confidence ). Iterative risk management is a useful 5 framework for decision-making in situations characterized by large potential consequences, persistent uncertainties, 6 long timeframes, potential for learning, and multiple influences changing over time, such as climate and non-7 climatic stressors. See Figure SPM.3. Assessment of the full range of potential future impacts, including low-8 probability outcomes with large consequences, is central to understanding future risks and the benefits and tradeoffs 9 of alternative risk management actions. The increasing complexity of adaptation actions across scales and contexts 10 means that institutional learning and monitoring are important components of effective adaptation. 22 11 12 Figure SPM.3: Illustration of iterative risk management. [Figure 2-1] 13 14 The benefits of mitigation and adaptation occur over different timeframes ( high confidence ). Figure SPM.4 15 illustrates projected climate futures under scenarios RCP2.6 and 8.5, along with observed temperature changes. 16 Projected global temperature increase over the next few decades is similar across emission scenarios (Figure 17 SPM.4B). 23 During this near-term era of committed climate change, risks will evolve as socioeconomic trends 18 interact with the changing climate. Societal responses, particularly adaptations, will influence near-term outcomes. 19 In the second half of the 21st century and beyond, global temperature increase diverges across emission scenarios 20 (Figure SPM.4B and 4C). 24 For this longer-term era of climate options, near-term and longer-term mitigation and 21 adaptation, as well as development pathways, will determine the risks of climate change. Near-term choices thus 22 affect the risks of climate change throughout the 21st century. 25 23 24 Figure SPM.4: Observed and projected changes in annual average temperature. (A) Observed temperature trends 25 from 1901-2012 determined by linear regression. Trends have been calculated where sufficient data permit a robust 26 estimate (i.e., only for grid boxes with greater than 70% complete records and more than 20% data availability in the 27 first and last 10% of the time period). Other areas are white. Solid colors indicate areas where change is significant 28 at the 10% level. Diagonal lines indicate areas where change is not significant. Observed data (range of grid-point 29 values: -0.53 to 2.50°C over period) are from WGI AR5 Figures SPM.1 and 2.21. (B) Observed and simulated 30 variations in past and projected future global annual average temperature relative to 1986-2005. Black lines show 31 the GISTEMP, NCDC-MLOST, and HadCRUT4.2 estimates from observational measurements. Blue and red 32 shading denotes the ±1.64 standard deviation range based on simulations from 32 models for RCP2.6 and 39 models 33 for RCP8.5; blue and red lines denote the ensemble mean for each scenario. For future projections, light-gray 34 vertical bands specify an indicative timeframe (2030-2040) for the near-term era of committed climate change and 35 an indicative timeframe (2080-2100) for the longer-term era of climate options. [Box CC-RC; WGI AR5 Figures 36 SPM.1 and SPM.7] (C) CMIP5 multi-model mean projections of annual average temperature changes for 2081-2100 37 under RCP2.6 and 8.5, relative to 1986-2005. Solid colors indicate areas with very strong agreement, where the 38 multi-model mean change is greater than twice the baseline variability and >90% of models agree on sign of change. 39 Colors with white dots indicate areas with strong agreement, where >66% of models show change greater than the 40 baseline variability and >66% of models agree on sign of change. Gray indicates areas with divergent changes, 41 where >66% of models show change greater than the baseline variability, but <66% agree on sign of change. Colors 42 with diagonal lines indicate areas with little or no change, where >66% of models show change less than 43 the baseline variability, although there may be significant change at shorter timescales such as seasons, months, or 44 days. Analysis uses model data (range of grid-point values across RCP2.6 and 8.5: 0.06 to 11.71°C) from WGI AR5 45 Figure SPM.8, with full description of methods in Box CC-RC. See also Annex I of WGI AR5. [Boxes 21-2 and 46 CC-RC] 47 48 Adaptation planning and implementation at a range of scales are contingent on values, objectives, and risk 49 perceptions ( high confidence ). Some types of adaptation options, such as insurance or large-scale infrastructure 50 22 2.1-4, 3.6, 14.1-3, 15.2-3, 15.5, 16.2-4, 17.2, 20.6, 22.4, 25.4, 25.10, Figure 1-5, Boxes 16-1 and 25-2 23 WGI AR5 11.3 24 WGI AR5 12.4 and Table SPM.2 25 2.5, 21.2-3, 21.5, Box CC-RC FINAL DRAFT (FGD) IPCC WGII AR5 Summary for Policymakers Do Not Cite, Quote, or Distribute 6 28 October 2013 projects, may differentially affect stakeholders. Recognition of diverse interests, values, and expectations, including 1 local and indigenous knowledge, can benefit decision-making processes. 26 2 3 Decision support is most effective when it is sensitive to context, taking into account the diversity of different 4 types of decisions, decision processes, and constituencies ( robust evidence, high agreement ) . Organizations 5 bridging science and policy play an important role in the communication and transfer of climate-related knowledge, 6 such as information on risks combining physical climate science and assessments of impacts, adaptation, and 7 vulnerability ( medium evidence, high agreement ). 27 8 9 Scenarios are useful tools for characterizing possible future socioeconomic pathways, climate change and its 10 risks, and policy implications ( high confidence ). Climate change risks vary substantially across plausible 11 alternative development pathways, and the relative importance of development and climate change varies by sector, 12 region, and time period. Both development and climate change are important determinants of possible outcomes. 13 Modeled future impacts assessed in this report are generally based on climate-model projections using the 14 Representative Concentration Pathway (RCP) and the older IPCC Special Report on Emission Scenarios (SRES) 15 scenarios. 28 16 17 Uncertainties about future vulnerability, exposure, and responses of human and natural systems can be 18 larger than uncertainties in regional climate projections, and they are beginning to be incorporated in 19 assessments of future risks ( high confidence ). Understanding future vulnerability, as well as exposure, of 20 interlinked human and natural systems is challenging due to the number of relevant socioeconomic factors, which 21 have been incompletely considered to date. These factors include wealth and its distribution across society, patterns 22 of aging, access to technology and information, labor force participation, the quality of adaptive responses, societal 23 values, and mechanisms and institutions to resolve conflicts. Cross-regional phenomena are also important for 24 understanding the ramifications of climate change at regional scales. 29 25 26 27 B) FUTURE RISKS AND OPPORTUNITIES FOR ADAPTATION 28 29 This section presents future risks and more limited potential benefits across sectors and regions, examining how they 30 are affected by the magnitude and rate of climate change and by development choices. It also points to opportunities 31 for reducing risks through mitigation and adaptation. The section describes risks and potential benefits over the next 32 few decades, the near-term era of committed climate change, and in the second half of the 21st century and beyond, 33 the longer-term era of climate options. 34 35 B-1. Key Risks across Sectors and Regions 36 37 Many risks of climate change warrant consideration. Key risks, in particular, are potentially severe impacts relevant 38 to “dangerous anthropogenic interference with the climate system,” as described in Article 2 of the United Nations 39 Framework Convention on Climate Change. Key risks can involve potentially large or irreversible consequences, 40 high probability of consequences, and/or limited adaptive capacity. Key risks are integrated into five overarching 41 reasons for concern (RFCs) in Box SPM.4. 42 43 Key risks that span sectors and regions ( high confidence ) include the following, each of which contributes to 44 one or more RFC. 30 45 i. Risk of death, injury, and disrupted livelihoods in low-lying coastal zones and small island developing states, 46 due to sea-level rise, coastal flooding, and storm surges. 31 [RFC 1-5] 47 ii. Risk of food insecurity linked to warming, drought, and precipitation variability, particularly for poorer 48 populations. 32 [RFC 2-4] 49 26 2.2-4, 12.3, 15.2, 16.2-4, 16.5-7, 17.2-3, 21.3, 22.4, 25.4, 25.8, 26.7, 26.9, 28.2, 28.4, Table 15-1, Boxes 16-1, 16-4, and 25-7 27 2.1-4, 8.4, 14.4, 16.2-3, 16.5, 21.2-3, 21.5, 22.4, Box 9-4 28 1.1, 1.3, 2.2-3, 19.6, 20.2, 21.3, 21.5, 26.2, Box CC-RC; WGI AR5 Box SPM.1 29 11.3, 21.3-5, 25.3-4, 25.11, 26.2 30 19.2-4, 19.6, Table 19-4, Boxes 19-2 and CC-KR 31 5.4, 8.1-2, 13.1-2, 19.2-4, 19.6-7, 24.4-5, 26.7-8, 29.3, 30.3, Tables 19-4 and 26-1, Figures 7-4 and 26-2, Boxes 25-1, 25-7, and CC-KR 32 3.5, 7.4-5, 11.3, 11.6, 13.2, 19.3-4, 19.6, 22.3, 24.4, 25.5, 25.7, 26.5, 26.8, 27.3, Table 19-4, Boxes CC-KR and CC-VW Activity (3) Filters Add to collectionReviewAdd noteLikeEmbed 1 hundred reads|2 days ago More From This User Economists Letter on Financial Transaction Tax Jon Queally Big Dollars Little Sense Report Jon Queally Analysis of Democracy is for People Amendment Jon Queally Amendment Fact Sheet Jon Queally Democracy for People Jon Queally Download and print this document Read and print without ads Download to keep your version Edit, email or read offline Choose a format:
© Copyright 2013 Scribd Inc.Language:English