
Date: 2026-01-17 Page is: DBtxt003.php txt00004455
Metrics
Calvert-Henderson Quality of Life Indicators
The Calvert-Henderson Income Indicator
Burgess COMMENTARY
Peter Burgess
The Calvert-Henderson Income Indicator focuses on trends in the standard of living as reflected in monetary measures of family income.
The trends in the level and distribution of family income since 1947 are explained with a particular focus on what has been the key determinant of family income trends - changes in hourly wages. Growing income inequality since 1973 is explored, along with changes in people's wealth holdings. The Income Indicator offers a provocative and thoughtful way to assess our economy's performance in raising living standards during the economic boom of the 1990s.
Income Expert: Lawrence Mishel, Ph.D.
Update on Income in the United States
Table 1. Median Family Income, 1947-2010
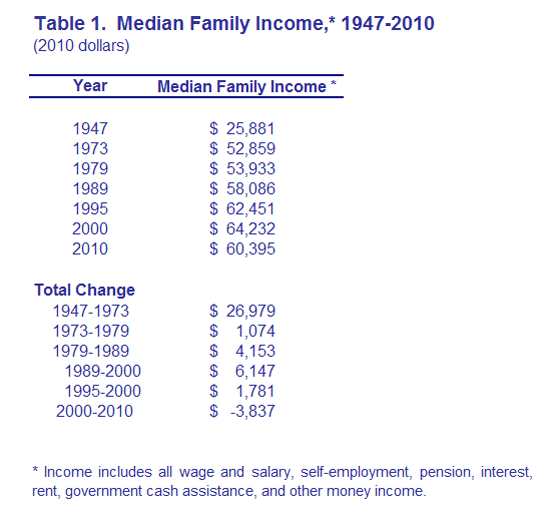
Figure 1. Median Family Income
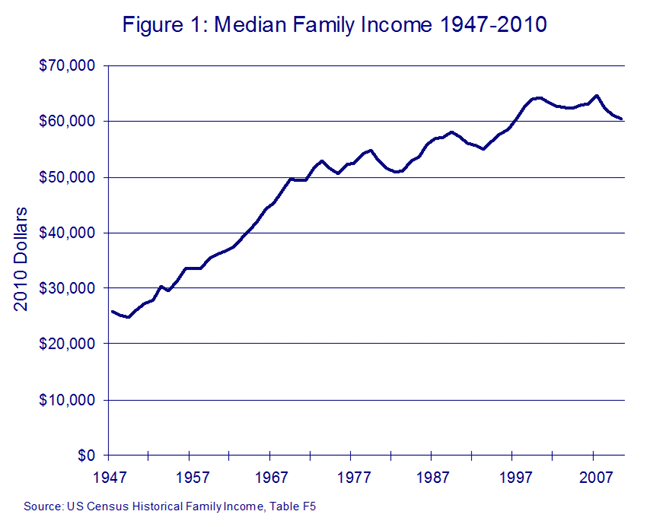
Table 2. Annual Growth of Median Family Income, 1947-2010
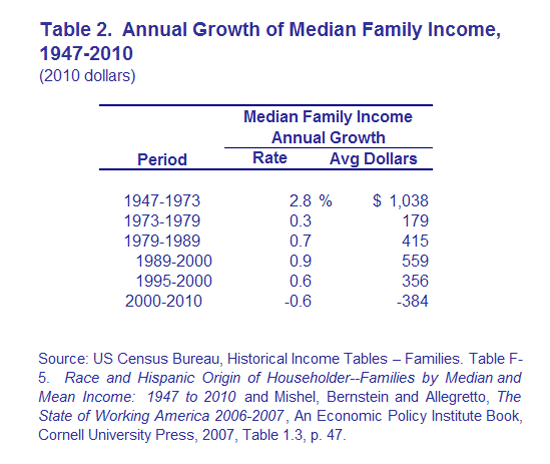
Table 3. Shares of Family Income Going to Various Income Groups
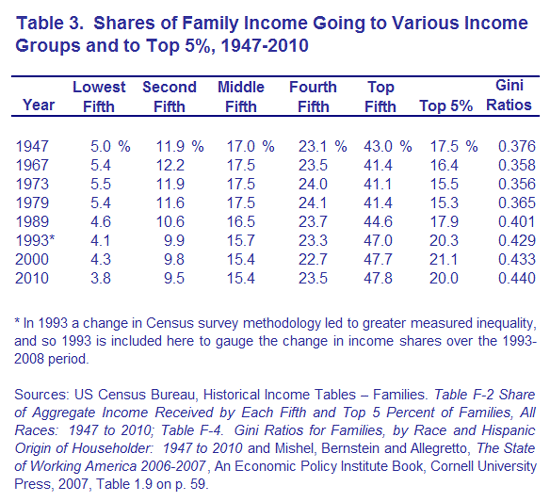
Table 4. Real Family Income Growth by Income Group, 1979-2007
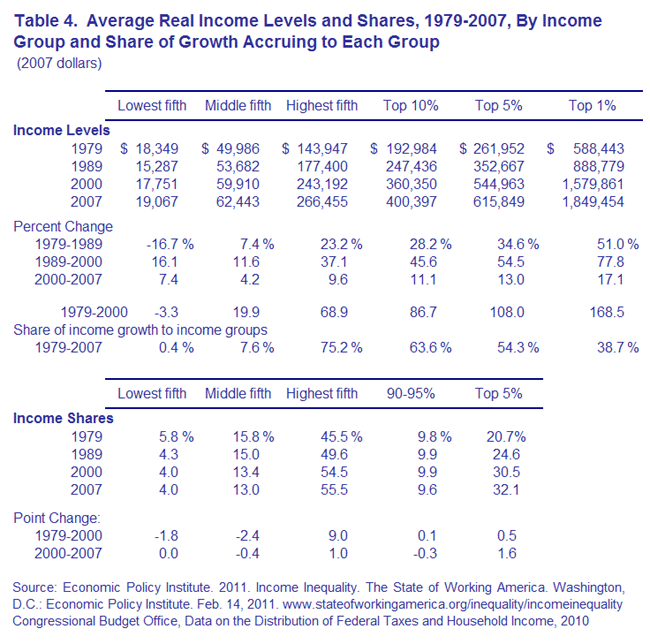
Table 5. Wages for Female Workers by Wage Percentile, 1973-2009
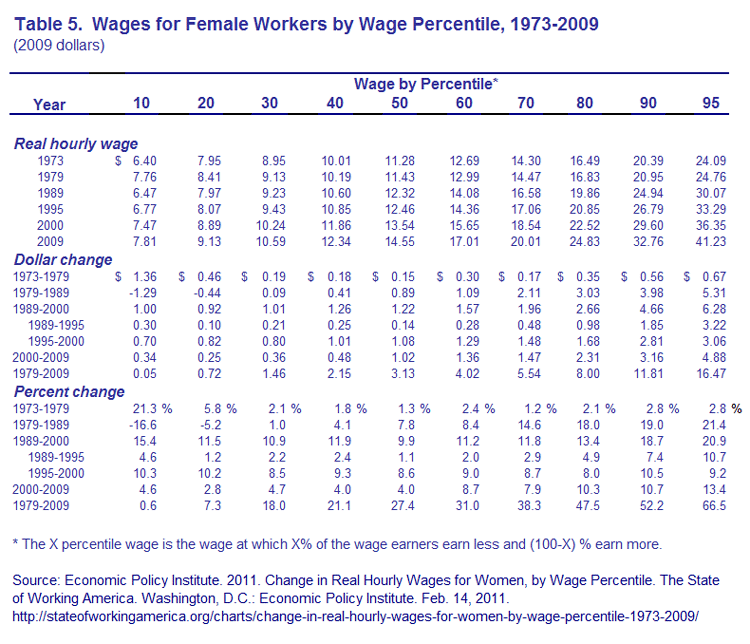
Table 6. Wages for Male Workers by Wage Percentile, 1973-2009
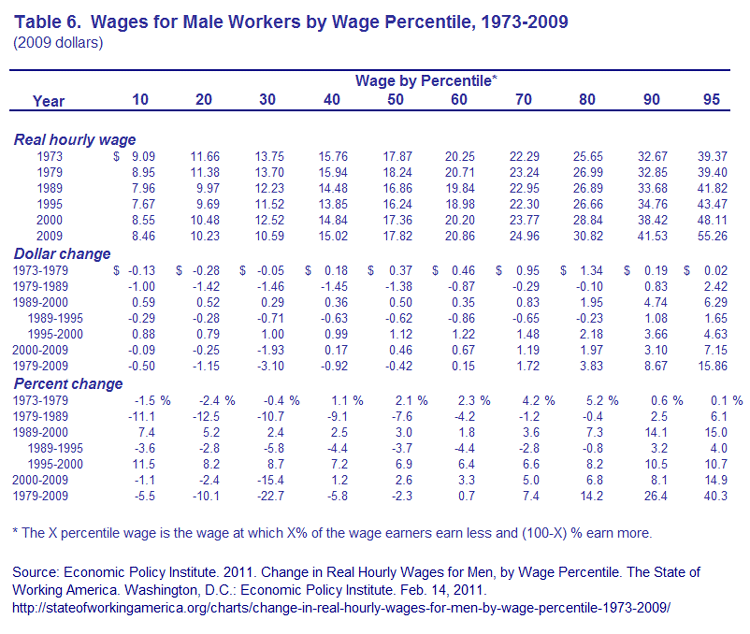
Table 7. Wages for All Workers by Wage Percentile, 1973-2009
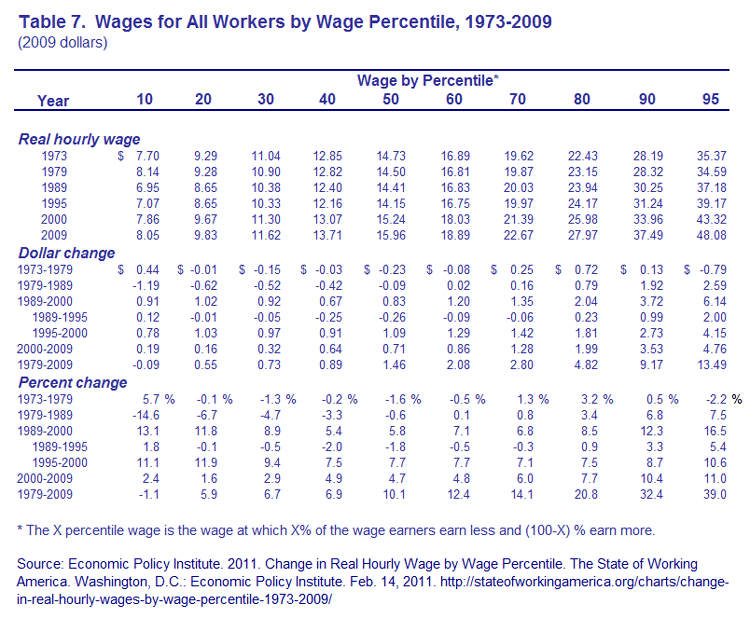
Table 8. Dimensions of Wage Inequality, 1973-2007
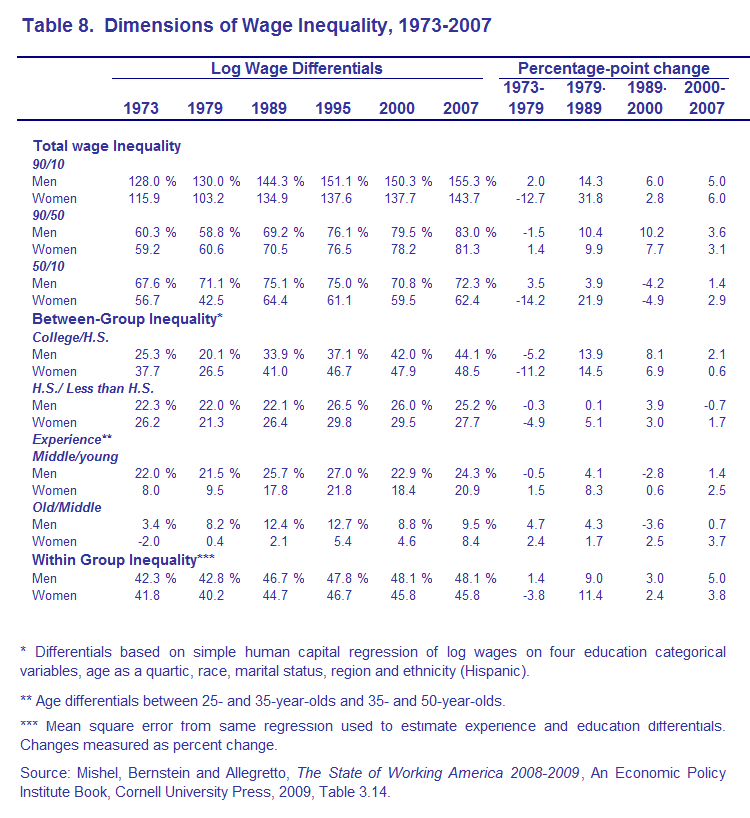
Figure 2. Women's Wage Inequality, 1973-2009
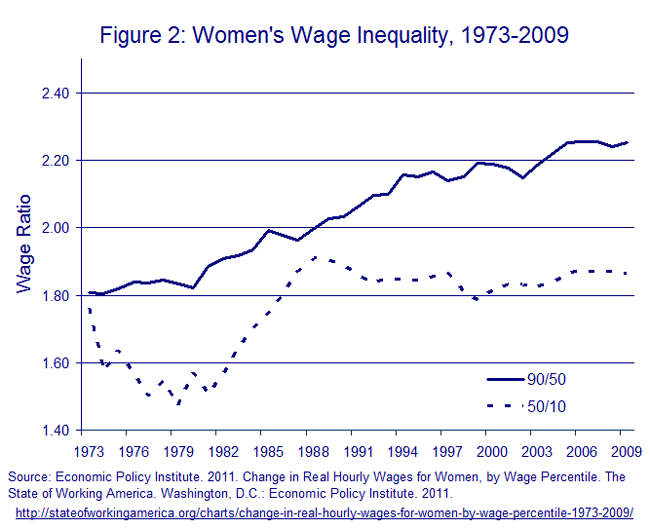
Figure 3. Men's Wage Inequality, 1973-2009
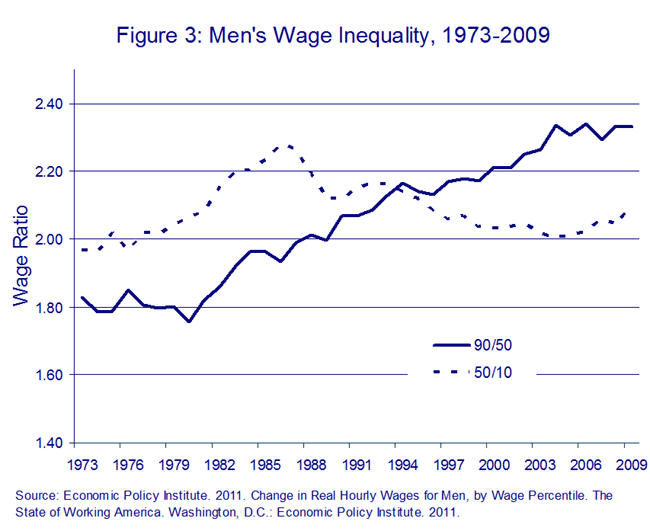
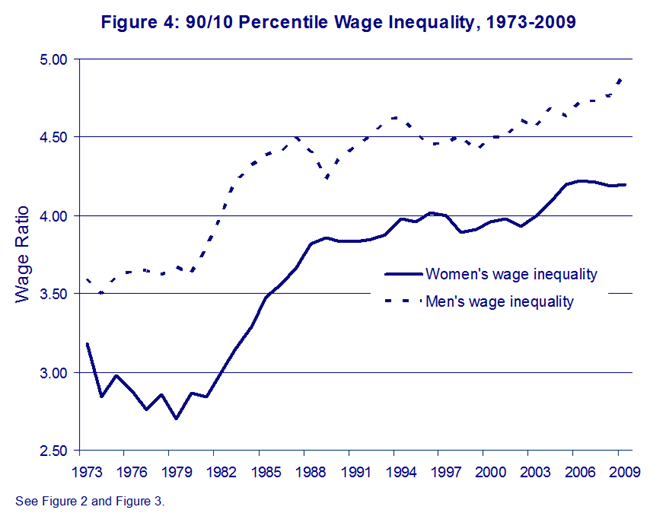
Figure 4. 90/10 Percentile Wage Inequality, 1973-2009
Income Indicator by Lawrence Mishel, Ph.D. (Updated July 18, 2001)
A person's income critically contributes to economic well-being; in turn, economic well-being is a critical component of a person's overall quality of life. This note explains some of the key recent trends in income and wages. A fuller explanation of the 'Income Model' which frames this discussion can be found in the Calvert-Henderson Quality of Life Indicators volume. A more complete elaboration of trends in income, wages, employment, wealth, poverty, taxes and trends in other living standard indicators can be found in Mishel, Bernstein and Schmitt, The State of Working America, 2000-2001.1
There are two aspects of recent economic trends that are bedeviling. First, the traditional (and best) way to present economic trends is to examine changes over a business cycle (i.e., peak to peak) such as comparing growth between periods of low employment or economic recoveries. However, the 1990s business cycle had three distinctive phases-the initial downturn (from 1989-91 or 1989-92 depending upon how you measure it ), a sluggish recovery up through 1995, and then a period of rapid growth after 1995. Thus, the discussion and the data presentation allow for an analysis of the whole cycle from 1989-2000 while also noting the more positive trends of the late 1990s.
The second bedeviling feature of the economy is that an economic slowdown began in late 2000 and, by mid-2001, was responsible for at least a 0.5 percent rise in unemployment and a rise in underemployment nearly three times as much. Because most of the recently available data are for 1999 and 2000, this slowdown and possible arrival of a recession cannot be adequately incorporated into our analysis.
The tables accompanying this online update present the growth of the median family income using the official Census Bureau measure which captures all wage and salary income, pension, interest, government cash assistance, and other money income. The 'median income' is the income of a family in the middle, where half the families have higher income but half the families have lower income. Thus, median family income captures the income growth of people in the 'middle.'
By 1999, the median family's income had grown to $48,950, $2,983 more than in 1989. Note, however, that income fell $1,572 from 1989 to 1992 but then grew $4,555 from 1995 to 1999. To compare this growth to other periods it is best to reference the rates of growth in. The rate of growth over the 1989-99 business cycle was 0.6 percent each year, not very different from the growth in the prior two cycles (1973-79, 1979-89) and far below the growth rates in the 1947-73 era. The growth since 1995, however, was a healthy 2.6 percent.
The next set of tables illustrates shifts in income inequality by showing that incomes grew at different paces for different income groups. There was a period of fast and equalizing growth from 1947 to.1973, reflected in the falling income share of the top fifth. A contrary trend towards greater inequality took root in the 1980s and continued into the 1990s.
Moreover, incomes grew quickly and comparably across the board from 1947 to 1973, with somewhat faster growth in the bottom 60 percent. In contrast, incomes grew far faster at the top in the 1980s and 1990s, as seen in the 1.5 percent annual income growth at the 95th percentile (percentile representing a family that has more income than 95 percent of families).
The primary determinant of the pattern of income growth-how fast and its distribution-is the pattern of wage growth and, specifically, the growth of wages and salaries per hour worked. The next tables present data on the growth of wages among, respectively, men and women.
A useful starting point is to track the hourly wage of the median (or 50th percentile) male and female, a wage representing the experience of the typical man and woman wage earner. The median male wage fell continuously over the 1980s (down 9.1 percent) and through the early 1990s (another 6.3 percent decline by 1995). The median male wage grew 5.5 percent over the 1995-99 period, fast growth but not enough to offset the decline in the early 1990s. Over the entire 1979-99 period there was a 10.2 percent fall in the median male wage.
In contrast, the median women's wage grew slowly over the 1980s (up 5.7 percent from 1979 to 1989) and fell slightly in the early 1990s. The late 1990s was a period of fast growth for the typical woman worker, as wages grew 5.8 percent between 1995 and 1999. As is well known, there has been a widening of wage inequality since 1989, reflecting a lower wage growth for middle and low-wage workers relative to high earners. This can be seen by noting that wages at the 90th percentile (earns more than 90 percent of workers) and at the 95th percentile workers, among both men and women, have grown far faster than the wages of middle wage workers. For instance, the 95th percentile wage has grown 17.9 percent and 38.6 percent, respectively, among men and women. The increasing gap between high and middle-wage workers can be seen in the trends of the 90/50 differential (the ratio of the 90th to the 50th percentile wage) especially, in the 95/50 differential, graphically illustrated in the accompanying figures. There was a more complicated pattern of wage growth at the bottom of the wage scale. Low wage workers, men and women, fared considerably worse than middle wage workers in the 1980s. For example, the wage of the 10th percentile (makes less than 90 percent of workforce) worker fell 12.7 percent and 18.2 percent among, respectively, men and women. The wages of low-wage men (i.e., at the 10th percentile) continued to fall in the early 1990s but rose a rapid 9.8 percent over the 1995-99 period. The wages of low-wage women rose a very modest 1.6 percent in the early 1990s and then, as with men, grew rapidly after 1995. It is remarkable that wages at the bottom grew faster than those at the middle and top (excepting the very highest wage males) in the late 1990s. The wage gap between the middle and the bottom, shown as the 50/10 wage differentials, reflect these trends-a rapidly widening wage gap in the 1980s followed by a shrinking of the wage gap in the 1990s. The final table presents trends on particular dimensions of the wage structure that are frequently discussed. Measures of the overall wage gap such as the 50/10 and 90/50 wage gaps are presented at the top of the table. Measures of wage gaps between certain groups, such as by education (e.g., college, high school) and experience are also shown. The last measure-within-group wage inequality-shows the growth of wage inequality among workers of similar education and experience by gender. The growth of this within-group wage inequality accounts for at least half the growth of overall wage inequality. Those interested in obtaining data on these and other income and wage trends can visit EPI's Datazone where downloadable spreadsheets are available (http://epinet.org/books/swa2000/index.html). ENDNOTES
- 1 An Economic Policy Institute Book, Ithaca, NY: ILR Press, an imprint of Cornell University Press or see excerpts at http://epinet.org/books/swa2000/index.html