Date: 2025-12-13 Page is: DBtxt003.php txt00004445
Metrics
Calvert-Henderson Quality of Life Indicators
The Calvert-Henderson Employment Indicator
Burgess COMMENTARY
Peter Burgess
 One of the hallmarks of politics, academia, and activism, in the USA and increasingly globally, is the integration of three previously distinct fields: economics, social welfare, and the environment. This integration helps deepen the dialogue about quality of life by employing a systems approach to make explicit the inherent interdependences between factors impacting quality of life.
The downside, however, is that issues are viewed as more complex, which naturally leads to hotly contested public policy debates and sometimes direct conflicts between people who in their hearts support similar values. Examples include today's debates about trade policy, outsourcing manufacturing and increasingly services like call centers to countries with lower wages such as Mexico, China and India. There is also the debate about immigration and whether more guest workers decrease average U.S. or increase US economic growth.
The Calvert-Henderson Employment Indicator recognizes this tension while at the same time encourages an expanded view of work and workplaces in the context of broader societal conditions. The Employment Indicator is organized as follows in consultation with labor economist, Patrice Flynn:
First, the Calvert-Henderson Employment Model visually presents the structure of employment in the United States as originally designed by the War Manpower Commission during World War I and refined by the US Department of Labor's Bureau of Labor Statistics in 1950. For a more in-depth explanation of how US government labor statistics are collected and organized, please see the Calvert-Henderson Quality of Life Indicators volume (2000).
Second, historical data are presented illuminating key labor market trends from the mid-20th century to date. Information is included on such topics as employment, unemployment, labor force participation, alternative work arrangements, demographic shifts, and nonmarket work.
For more information on the changes in the labor market, including how the current measures of unemployed workers and the national unemployment rate understate the true extent of the unemployment problem in the US and how the 2001 recession began the only period of sustained job losses for women, see the Economic Policy Institute's JobWatch web site (www.jobwatch.org). EPI's President, Lawrence Mishel, is on the Calvert-Henderson Quality of Life Indicators Advisory Board.
Table 1. Civilian Labor Force, 1948-2011 (updated November, 2012)
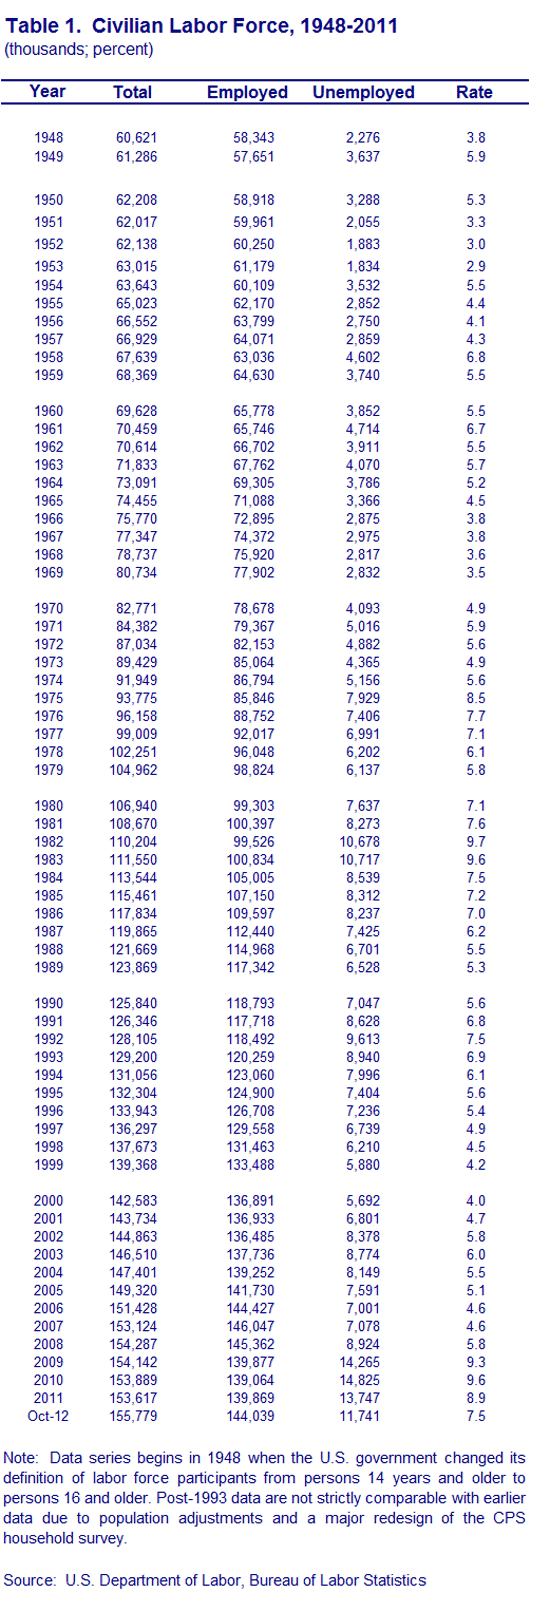 Table 2. Selected Civilian Unemployment Rates, 1975-2011
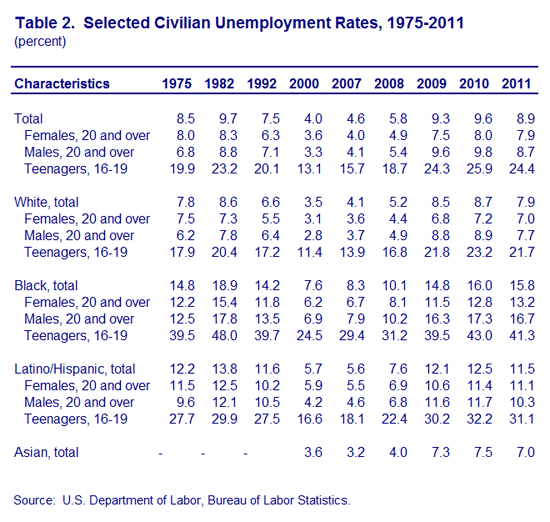 Table 3. Duration of Employment, 1968-2011 (updated November, 2012)
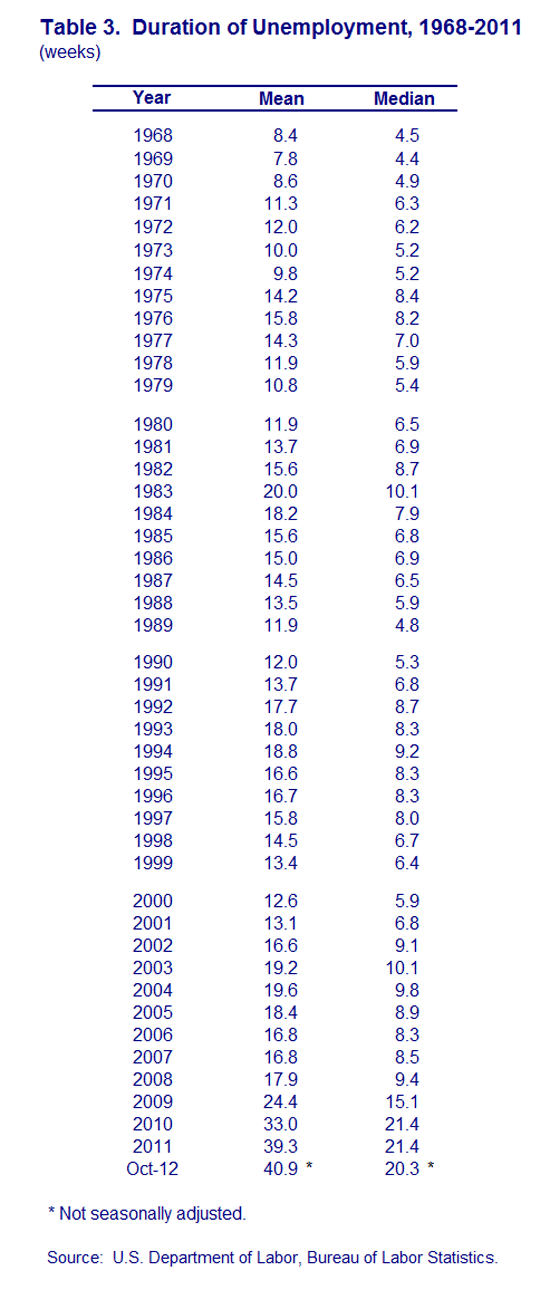 Table 4. Reason for Unemployment, 1967-2011
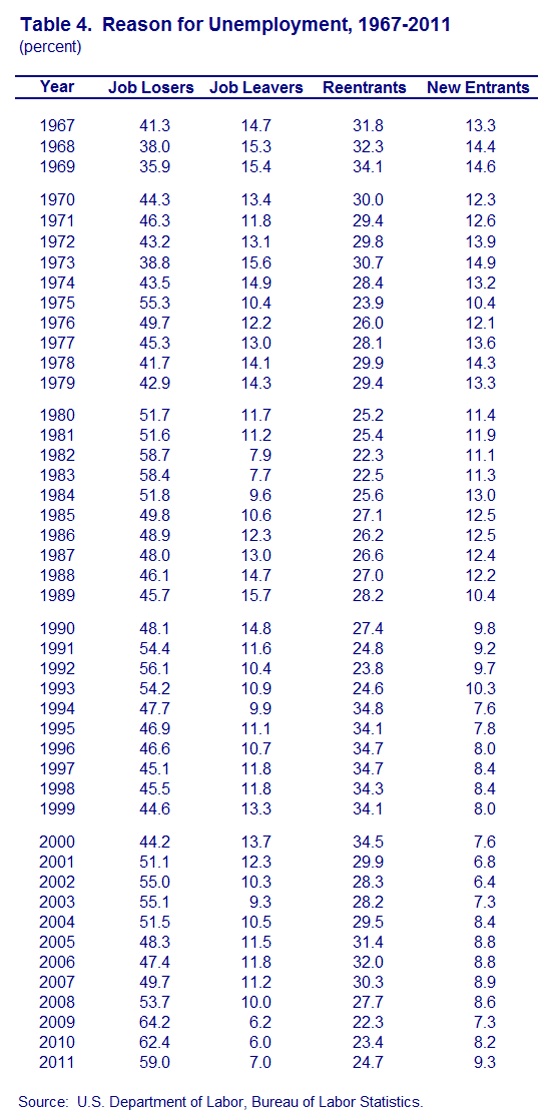 Table 5. Selected Civilian Labor Force Participation Rates (1970-2011)
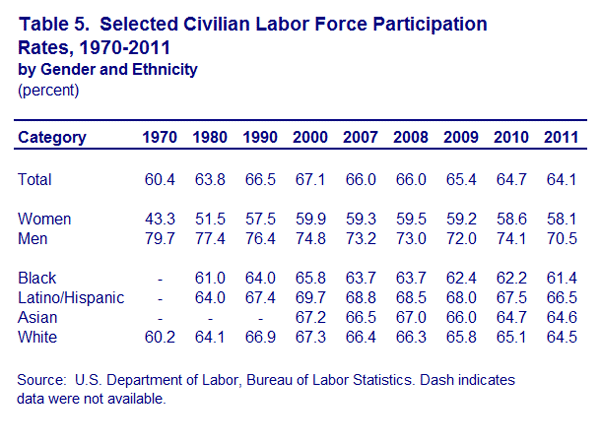 Table 6. Labor Force Participation Rate and Employment-to-Population Ratio (1948-2011)
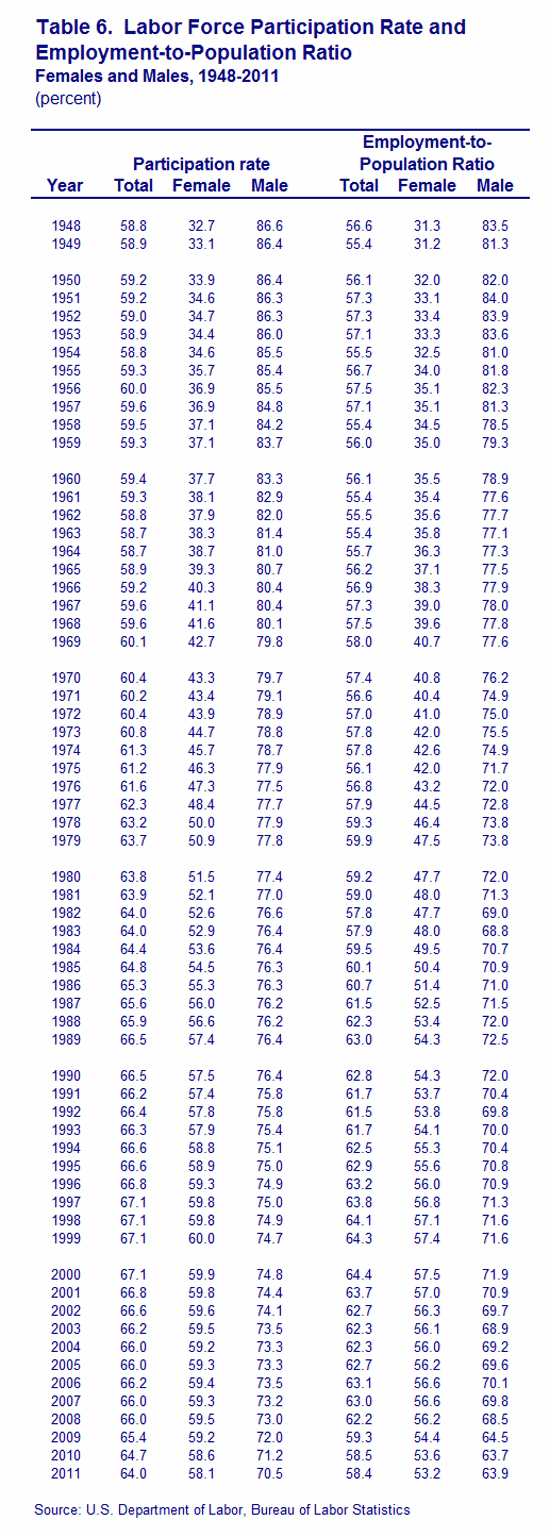 Table 7. Distribution of Full-time and Part-time Workers in 2011
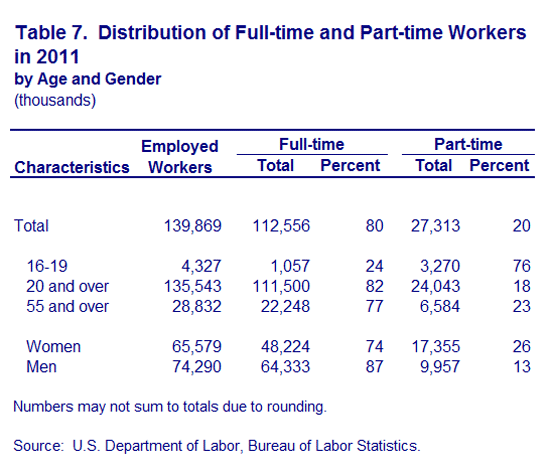 Table 8. Contingent and Noncontingent Workers in 2005 (latest available)
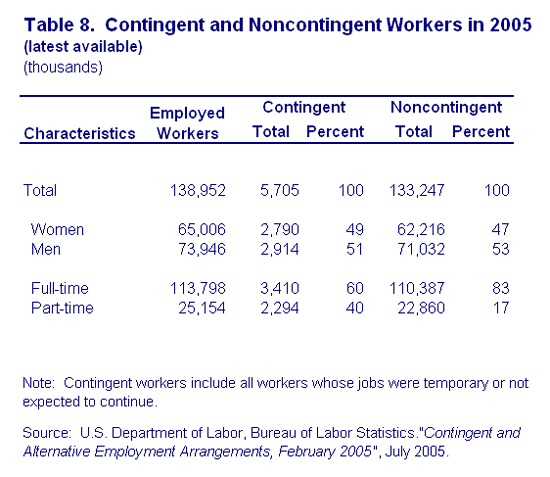 Table 9. Multiple Job Holders, 1999-2011
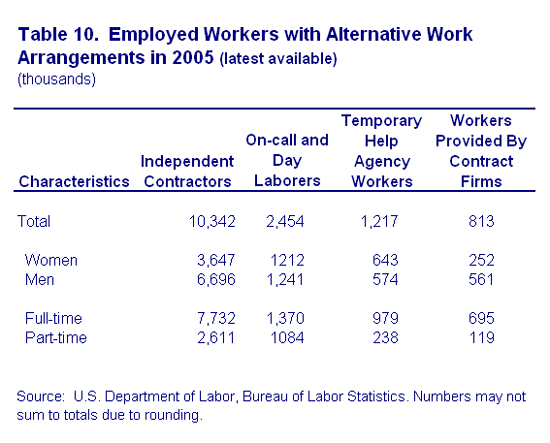
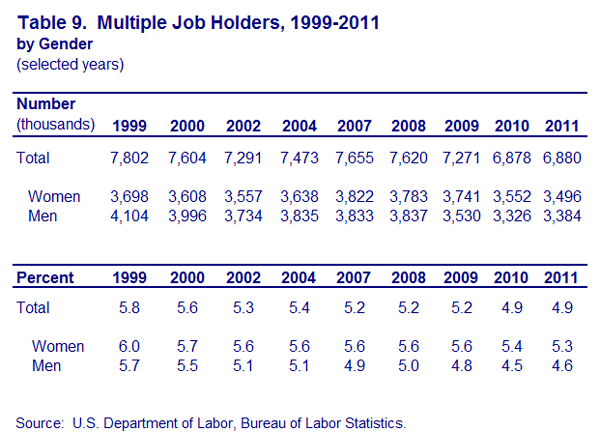 Table 10. Employed Workers with Alternative Work Arrangements in 2005 (latest available)
