NATURAL CAPITAL
GHGs
Greenhouse gases are a primary reason why planet earth is warming
|
|
|
|
Climate change and global warming is an existential threat ... NOW!
|

Extreme snow
|
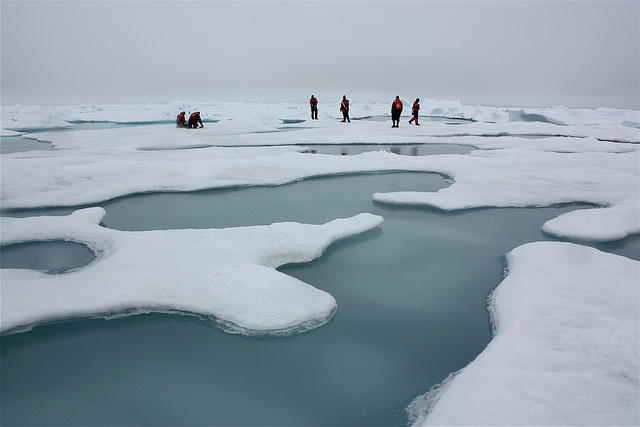
Arctic Ice Melt
|

Polar Bears
|
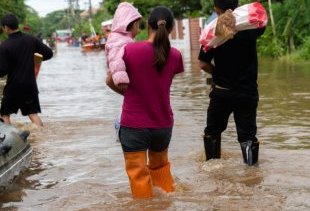
Houston Floods
|

Superstorm Sandy
|
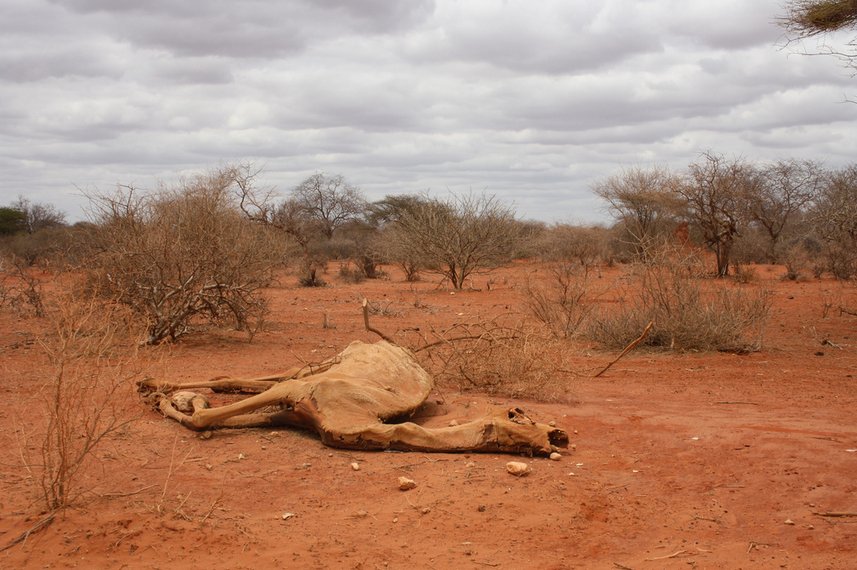
Sahel drought
|
Green House Gas (GHG) Emissions
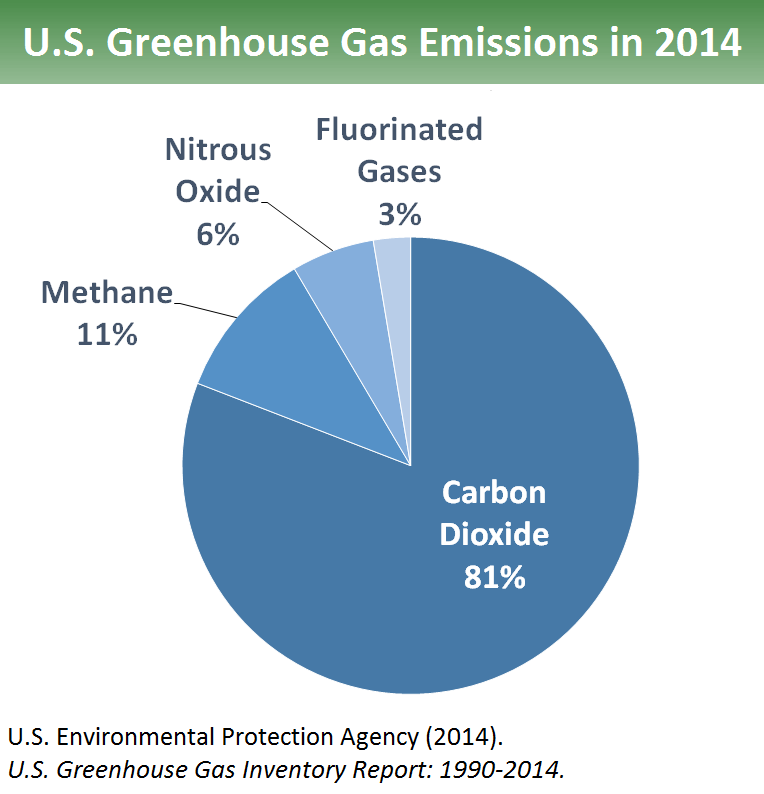
The scientific community has concluded that green house gas (GHG) emissions are in the process of changing the world's climate. This is sometimes referred to as global warming, but the changes are likely to be quite unpredictable as climate systems change significantly. For example, a change in the Gulf Stream that warms Europe could result in a Europe that becomes significntly colder than it now is. Carbon Dioxide emissions (CO2e) are the highest volume of GHGs, but methane emissions (CH4e) are more potent than CO2e by a factor of more than 20.
Almost every human activity, especially those involving the consumption of energy, produce GHGs. The people of the USA and Canada are among the highest per capita producers of GHGs.
|
Rules and Regulations for Environmental Responsibility
Until quite recently there virtually no rules and regulations to ensure that economic actors were environmentally responsible. Essentially, it was 'laissez faire' ... anything goes ... and as long as it was profitable for me, then I am going to do it.
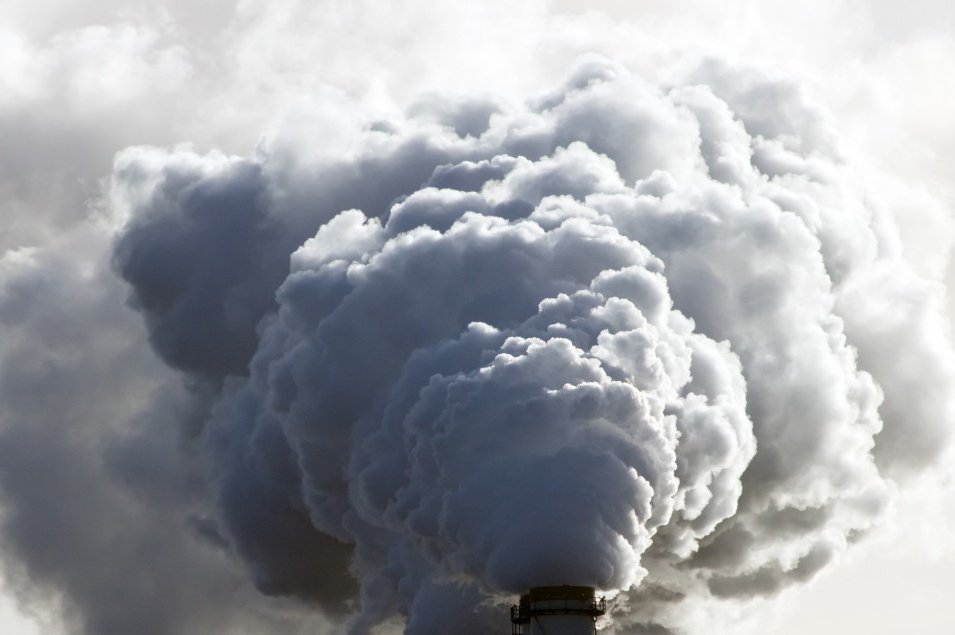
For most of the industrial revolution, environmental pollution was awful.
TPB aside: As a young child I spent many Christmas and Easter holidays staying with my grandparents who lived in Wakefield in the West Riding of Yorkshire, in the industrial North of England ... a huge contrast from our home in Okehampton, a small agricultural market town in the middle of Devonshire. I remember being told 'where there's muck, there's money' and being told that it was a good sign when the chimneys of the textile mills were spewing dark black smoke and a bad sign when they weren't. Everything was covered in grime ... soot from the smoke. And of course, we burnt coal to keep ourselves warm. and in fact, also cooked on a huge coal fired range!
|
|
|
The Global PACT
Follow up to the Paris Accord of 2015 (September 2017)
|
GO TOP
|
Global-Pact-for-the-Environment-Biniaz-2017-08
From the opening paragraph:
There is no doubt that more needs to be done, both nationally and internationally, to protect the environment. It is tempting, particularly during the Trump era, to welcome any concerted effort to do so. The issue is whether the proposed “Global Pact” is the right vehicle for enhancing environmental protection.
Part of the conclusion: A new “Global Pact” may or may not be the appropriate next step towards improving global environmental protection. Further consideration is warranted regarding the insufficiencies of the current system and the potential remedies, including the merits of an overarching international agreement on the environment. To the extent States decide to pursue a new, broadly framed agreement, they should take care to ensure that there is clarity concerning, inter alia, its purpose(s), its obligations, and its intended legal effect, including in relation to other international agreements of a more specific nature.
TPB observation: The Global PACT is an initiative being promoted by the French at high levels. It was launched during the 2017 UN General Assembly by Presdient Macron. I participated in a workshop at Columbia that addressed various issues relating to the PACT. I suggested that though it was unlikely to become widely accepted as a legally binding initiative on the member nations of the UN, it had a value as a catalyst for ongoing dialog about the need for behavior change related to the environment and climate change.
|
|
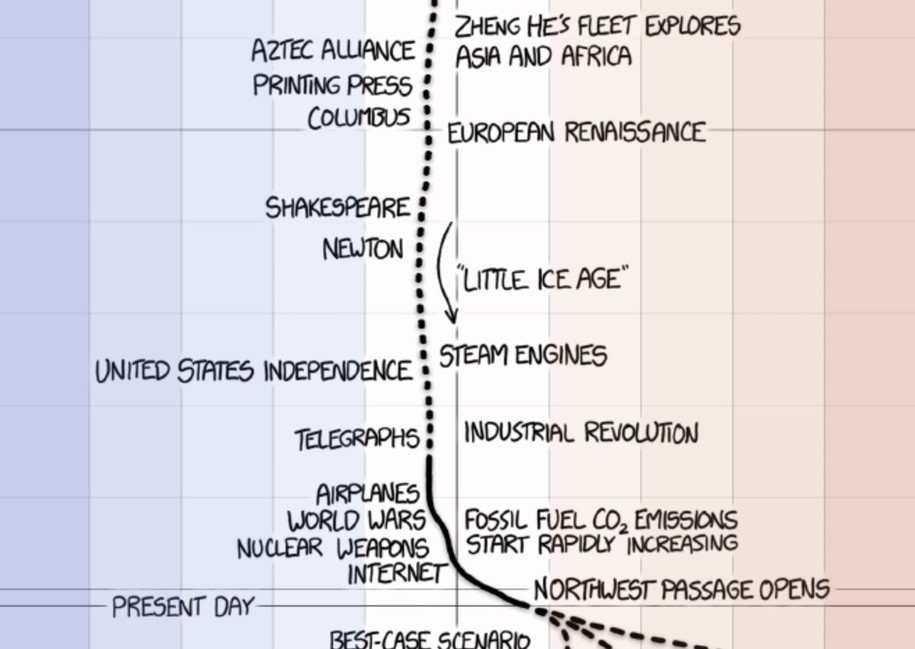
EARTH TEMPERATURE TIMELINE
|
THE LAST 600 YEARS
|
|
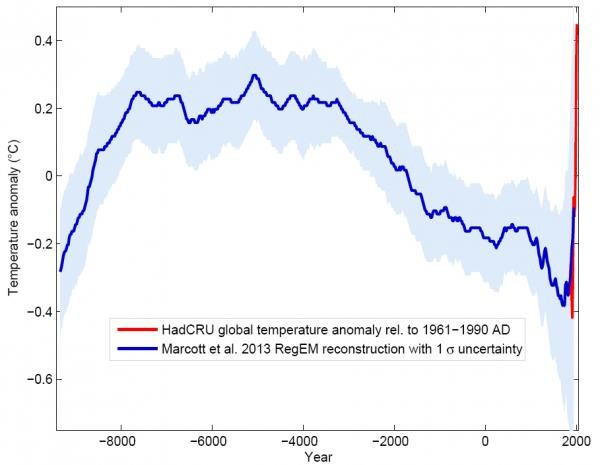
The rate of global warming that is taking place in the last few decades has never been experienced before. Geological data shows significant changes in temperature over thousands of years, but never wnything like this which is taking place decade after decade and year after year.
|
Earth Temperature Timeline ... 9000 BC - 2016 AD
|
Very long term temperature change ... a period of 10,000 years
The temperature rise in the last hundred years is 'off the chart'. Scientific data does not show evidence of temperature rise so fast at any previous time in history.
|
|
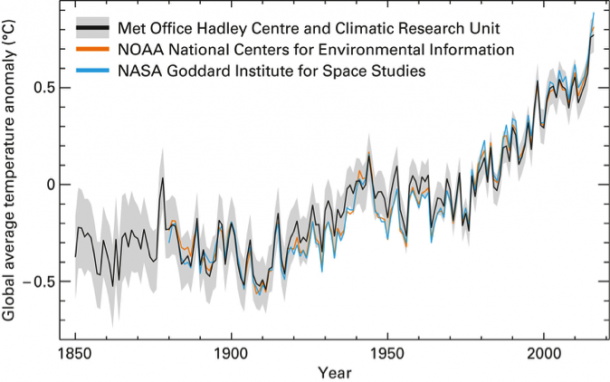
Land and Ocean Temperature Timeline
|
|
Earth Temperature Timeline ... 1850 - 2016
|
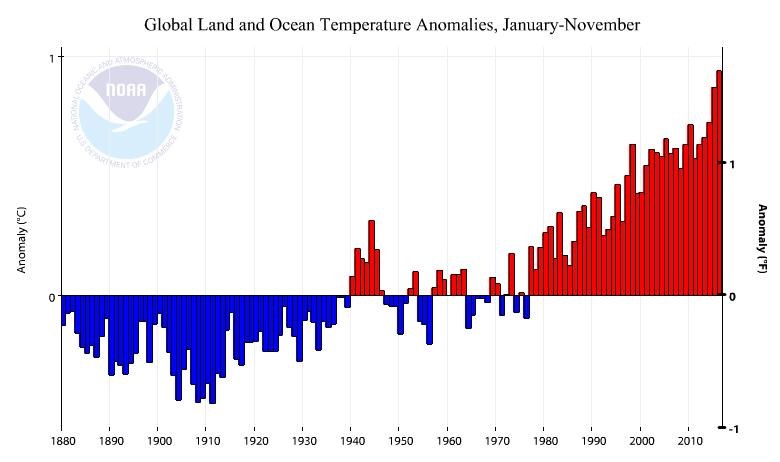
Temperature anomolies ... 1880 -2016
|
|
|
|
The temperature rise post 1980 has been continuous ... most likely reflecting the massive increase in scale of industrial activity in the past hundred years.
|
Global temperatures are on the rise again as 2016 has been marked as the hottest on record.
|
2016 WMO report: Climate Change ... Dangerous Trend ...
Planet Enters 'Uncharted Territory'
|
Open file 12947
|
TVM-MDIA-About-Carbon-131111a
'http://www.truevaluemetrics.org/DBpdfs/BMABusiness/TVM-MDIA/TVM-MDIA-About-Carbon-131111a.pdf'
|
Open PDF ... TVM-MDIA-About-Carbon-131111a
|
Methane ... Role of ruminant animals in the production of methane
Estimation of the methane production related to ruminant animal digestion
'http://www.truevaluemetrics.org/DBpdfs/GHGs/Methane/Role-of-Ruminant-Animals.pdf'
|
Open PDF ...
Role-of-Ruminant-Animals
|
EPA ... estimating emissions from different types of soils
'http://www.truevaluemetrics.org/DBpdfs/GHGs/EPA-c14s01.pdf'
|
Open PDF ...
Emissions by soil type
|
|
There are a mix of
|
|
|
|
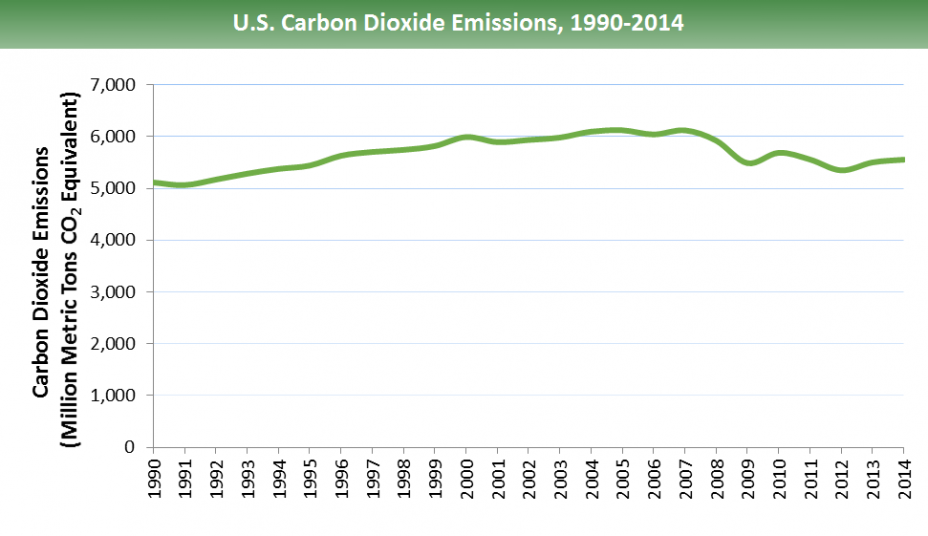
The total US GHG emissions for the USA are around 5 million metric kilo-tons CO2 equivalent per year ... for a population of around 320 million people.
Total emissions for China exceed 12 million metric kilo-tons CO2 equivalent per year ... for a population of more than 1.3 billion people ... up from less than 3 million metric kilo-tons CO2 equivalent in 1980
The per capita emissions of CO2 equivalent in the USA is in excess of 15 metric tons compared to China which is around 9 metric tons, up from less than 3 in the early 80s.
|
|
|
|
CO2 emissions (kt)
Carbon dioxide emissions are those stemming from the burning of fossil fuels and the manufacture of cement. They include carbon dioxide produced during consumption of solid, liquid, and gas fuels and gas flaring.
Source: Carbon Dioxide Information Analysis Center, Environmental Sciences Division, Oak Ridge National Laboratory, Tennessee, United States.
License Open
Aggregation Method: Gap-filled total ... Development Relevance:
Carbon dioxide (CO2) is naturally occurring gas fixed by photosynthesis into organic matter.
A byproduct of fossil fuel combustion and biomass burning, it is also emitted from land use changes and other industrial processes.
It is the principal anthropogenic greenhouse gas that affects the Earth's radiative balance.
It is the reference gas against which other greenhouse gases are measured, thus having a Global Warming Potential of 1.
Burning of carbon-based fuels since the industrial revolution has rapidly increased concentrations of atmospheric carbon dioxide, increasing the rate of global warming and causing anthropogenic climate change.
It is also a major source of ocean acidification since it dissolves in water to form carbonic acid.
The addition of man-made greenhouse gases to the Atmosphere disturbs the earth's radiative balance. This is leading to an increase in the earth's surface temperature and to related effects on climate, sea level rise and world agriculture.
Emissions of CO2 are from burning oil, coal and gas for energy use, burning wood and waste materials, and from industrial processes such as cement production. Emission intensity is the average emission rate of a given pollutant from a given source relative to the intensity of a specific activity. Emission intensities are also used to compare the environmental impact of different fuels or activities.
The related terms - emission factor and carbon intensity - are often used interchangeably.
The carbon dioxide emissions of a country are only an indicator of one greenhouse gas. For a more complete idea of how a country influences climate change, gases such as methane and nitrous oxide should be taken into account.
This is particularly important in agricultural economies.
The environmental effects of carbon dioxide are of significant interest. Carbon dioxide (CO2) makes up the largest share of the greenhouse gases contributing to global warming and climate change. Converting all other greenhouse gases (methane (CH4), nitrous oxide (N2O), hydrofluorocarbons (HFCs), perfluorocarbons (PFCs), sulphur hexafluoride (SF6)) to carbon dioxide (or CO2) equivalents makes it possible to compare them and to determine their individual and total contributions to global warming.
The Kyoto Protocol, an environmental agreement adopted in 1997 by many of the parties to the United Nations Framework Convention on Climate Change (UNFCCC), is working towards curbing CO2 emissions globally.
Limitations and Exceptions: The U.S. Department of Energy's Carbon Dioxide Information Analysis Center (CDIAC) calculates annual anthropogenic emissions from data on fossil fuel consumption (from the United Nations Statistics Division's World Energy Data Set) and world cement manufacturing (from the U.S. Department of Interior's Geological Survey, USGS 2011).
Although estimates of global carbon dioxide emissions are probably accurate within 10 percent (as calculated from global average fuel chemistry and use), country estimates may have larger error bounds.
Trends estimated from a consistent time series tend to be more accurate than individual values. Each year the CDIAC recalculates the entire time series since 1949, incorporating recent findings and corrections. Estimates exclude fuels supplied to ships and aircraft in international transport because of the difficulty of apportioning the fuels among benefiting countries.
Periodicity: Annual
Statistical Concept and Methodology: Carbon dioxide emissions, largely by-products of energy production and use, account for the largest share of greenhouse gases, which are associated with global warming. Anthropogenic carbon dioxide emissions result primarily from fossil fuel combustion and cement manufacturing. In combustion different fossil fuels release different amounts of carbon dioxide for the same level of energy use: oil releases about 50 percent more carbon dioxide than natural gas, and coal releases about twice as much. Cement manufacturing releases about half a metric ton of carbon dioxide for each metric ton of cement produced. Data for carbon dioxide emissions include gases from the burning of fossil fuels and cement manufacture, but excludes emissions from land use such as deforestation. The unit of measurement is kt (kiloton). Carbon dioxide emissions are often calculated and reported as elemental carbon. The were converted to actual carbon dioxide mass by multiplying them by 3.667 (the ratio of the mass of carbon to that of carbon dioxide).
|
Go to World Bank data
|
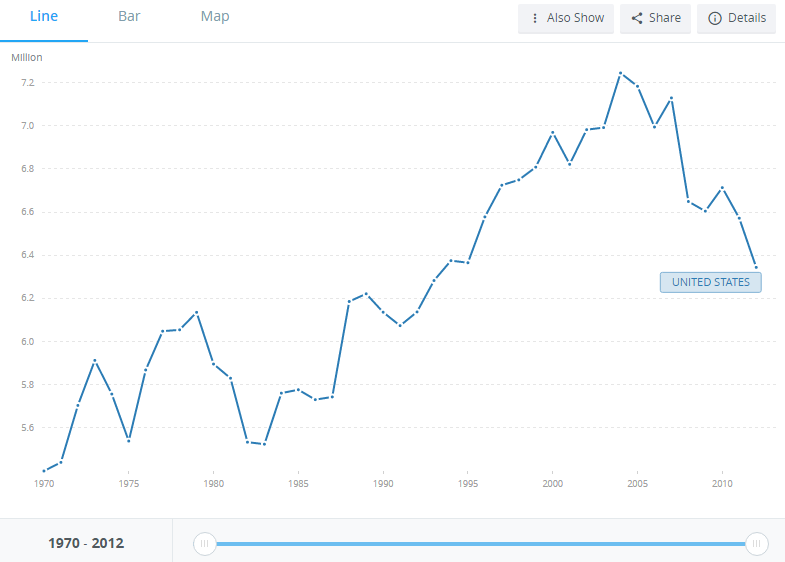
USA total greenhouse gas emissions (kt of CO2 equivalent)1970 - 2012
Annual total US emission of GHGs was around 7.2 million metric kilotons CO2 equivalent in 1984. In 2012 it was estimated to be under 6.4 million metric kilotons CO2 equivelent. In the period 1970 to 1985 total US emissions averaged around 5.8 million metric kilotons CO2 equivalent.
The amount of GHG emissions in the USA has a strong correlation with GDP and consumption. In the 1970s as a result of the global oil shock, economic growth in the USA was disrupted, especially for energy intensive industries, like for example, cement and steel. Economic growth in the 1980s and aggregate US emissions increased and then reduced as GDP and consumption and related production stalled.
With a population of around 320 million people, 6.4 million kilotons is equivalent to a per capita CO2 equivelent emission of 20 metric tons per person.
Source: European Commission, Joint Research Centre ( JRC )/Netherlands Environmental Assessment Agency ( PBL ). Emission Database for Global Atmospheric Research ( EDGAR ), EDGARv4.2 FT2012: edgar.jrc.ec.europa.eu
Note the difference in the y-axis between the USA graphic and the China graphic.
|
 Go to World Bank data
|
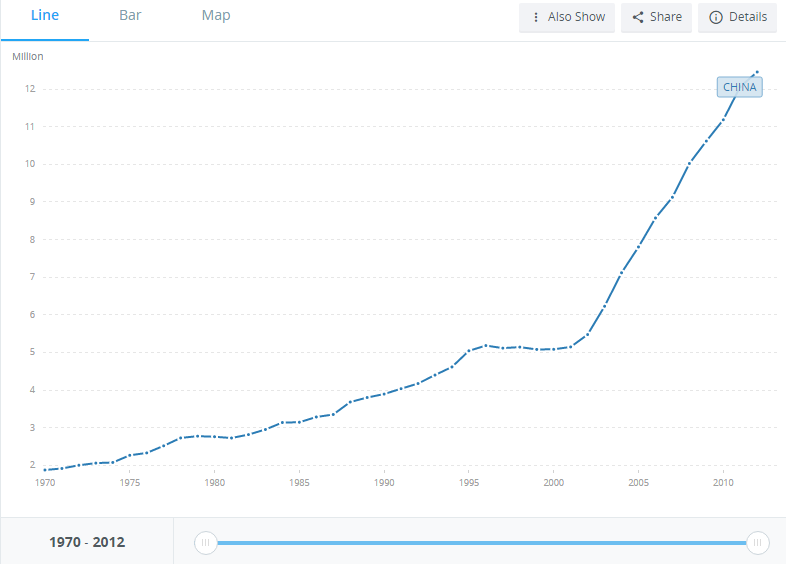
China total greenhouse gas emissions (kt of CO2 equivalent) 1970 to 2012
In 1970 the total GHG emissions were under 2 million metric kilotons CO2 equivalent. By 2012 this had risen to more than 12 million metric kilotons. As in the USA the total emissions has a strong correlation with the level of economic activity which has also grown rapidly in the same period.
With a population of 1.35 billion in 2012, and 12 million metric kilotons CO2 equivalent of emissions in total, the per capita emission computes to 8.9 metric tons CO2 equivalent per capita. The reported CO2 equivalent metric tons is 7.5 metric tons CO2 equivalent per capita. It is not obvious why these numbers are not somewhat closer.
Source: European Commission, Joint Research Centre ( JRC )/Netherlands Environmental Assessment Agency ( PBL ). Emission Database for Global Atmospheric Research ( EDGAR ), EDGARv4.2 FT2012: edgar.jrc.ec.europa.eu
The key takeaway from the comparison between USA and China is that the efficiency of the USA economy taking emissions into consideration is very low. Yhere is a huge potential to use modern technology and engineering to improve this efficiency.
|
|
|
 Go to World Bank data
|
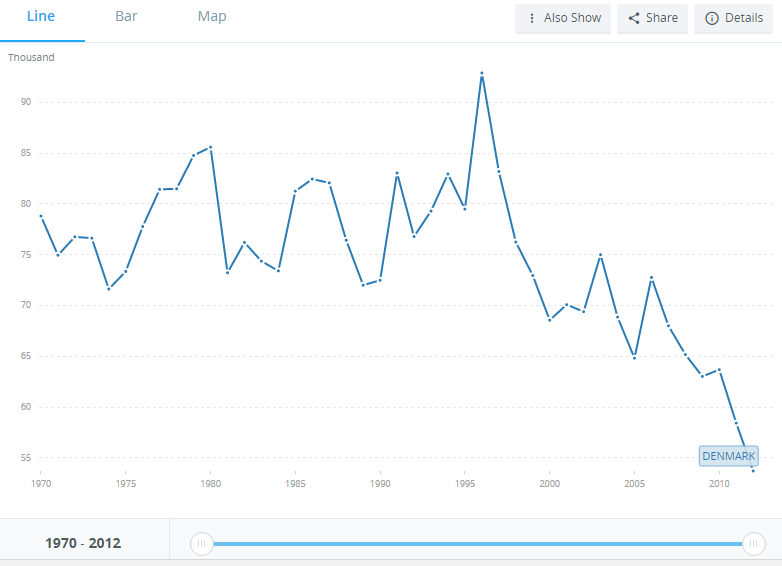
Denmark total greenhouse gas emissions (kt of CO2 equivalent) 1970 to 2012
From 1970 to 1990 there was a small upward trend in the total GHG emissions for the country. Since 1990 to 2012 there has been a substantial reduction in the total GHG emissions ... a reduction to a level that is about 50% of the 1970 to 1990 average emissions.
Source: European Commission, Joint Research Centre ( JRC )/Netherlands Environmental Assessment Agency ( PBL ). Emission Database for Global Atmospheric Research ( EDGAR ), EDGARv4.2 FT2012: edgar.jrc.ec.europa.eu
A similar takeaway arises from the comparison between USA and Denmark. The USA economy may be profitable in a financial sense, but taking emissions into consideration, the efficiency is very low. There is a huge potential to use modern technology and engineering to improve this efficiency. This should be the biggest sector for employment growth over the next few decades.
|
|
|
 Go to World Bank data
|
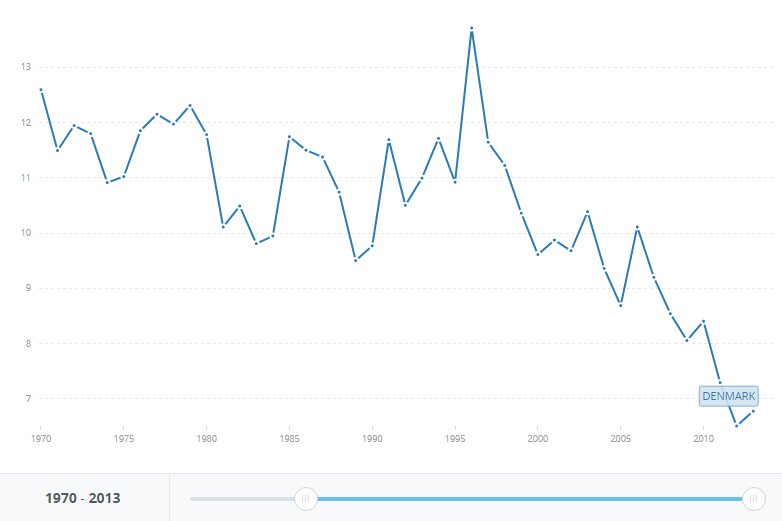
Denmark per capita C)2 emissions in metric tons CO2 per capita - 1970 to 2012
From 1970 to 1996 the per capita CO2 emissions was averaging around 11 tons per capita poer year. Since 1996 this has been dropping significantly and by 2012 had dropped below 7 tons per capita per year.
Source: European Commission, Joint Research Centre ( JRC )/Netherlands Environmental Assessment Agency ( PBL ). Emission Database for Global Atmospheric Research ( EDGAR ), EDGARv4.2 FT2012: edgar.jrc.ec.europa.eu
|
|
|
 Go to World Bank data
|
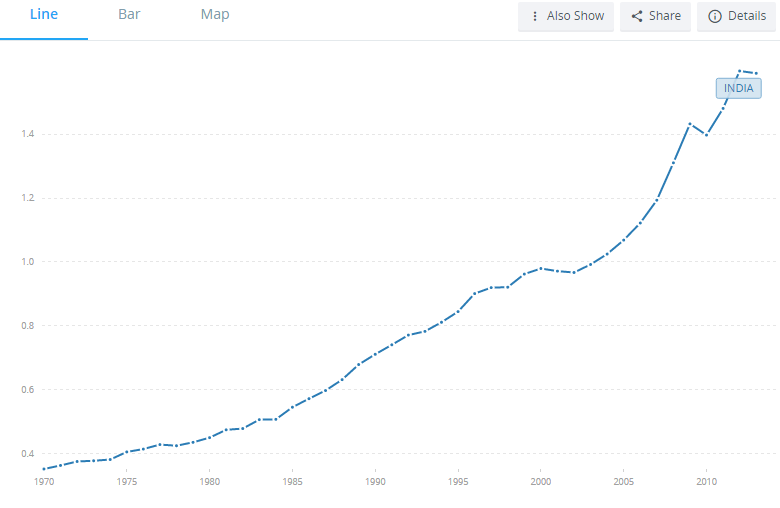
India CO2 emissions (metric tons per capita)... 1970 - 2012
There has been a very large increase in per capita CO2 emissions in India from 1970 to 2012. Per capita emissions in 2012 were calculated to be around 1.6 metric tons CO2 per capita. This compares with the US per capita CO2 emissions of 20 metric tons.
Source: Carbon Dioxide Information Analysis Center, Environmental Sciences Division, Oak Ridge National Laboratory, Tennessee, United States.
The population of India is around 1.1 billion. As the country modernises and increases its economic activity there will be a massive increase in the total GHG emissions from India. If the country embraces the US model for socio-enviro-economic development the total annual GHG emissions from India will increase by some 10 times. This would be catastrophic for climate stability, and for all practical purposes is being ignored by policy makers at the highest levels.
|
|
|
|
|
|
