|
.
|
|
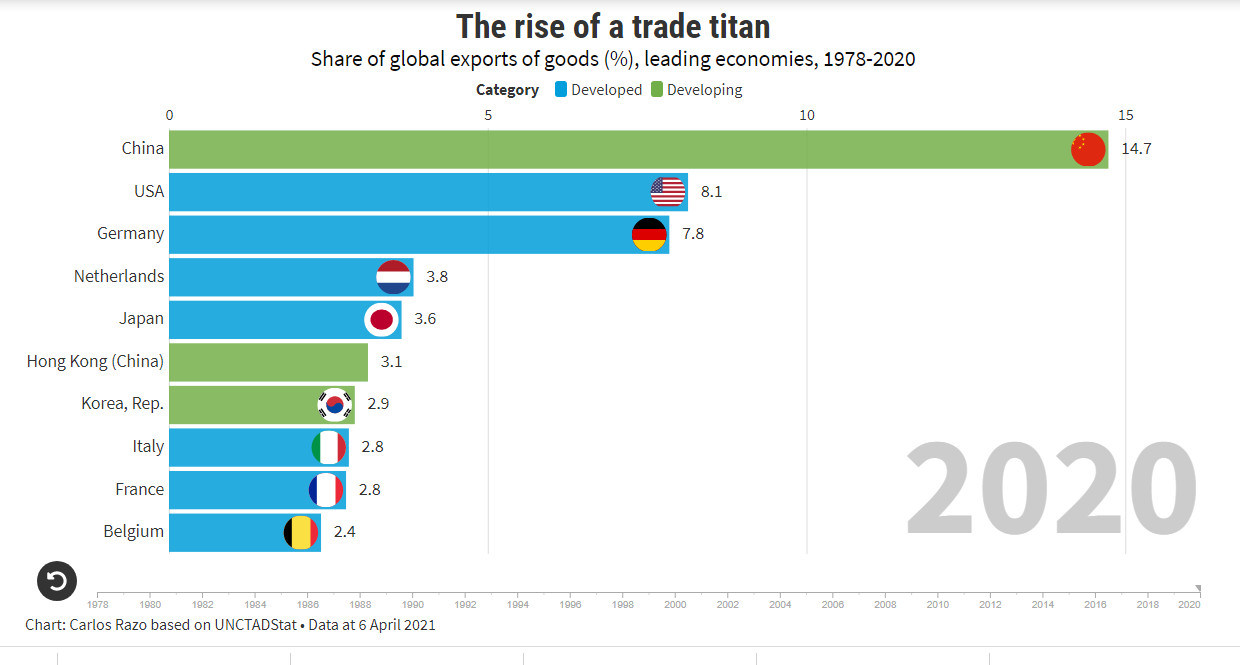
Top 10 Exporting Nations in 2020
|
|
|
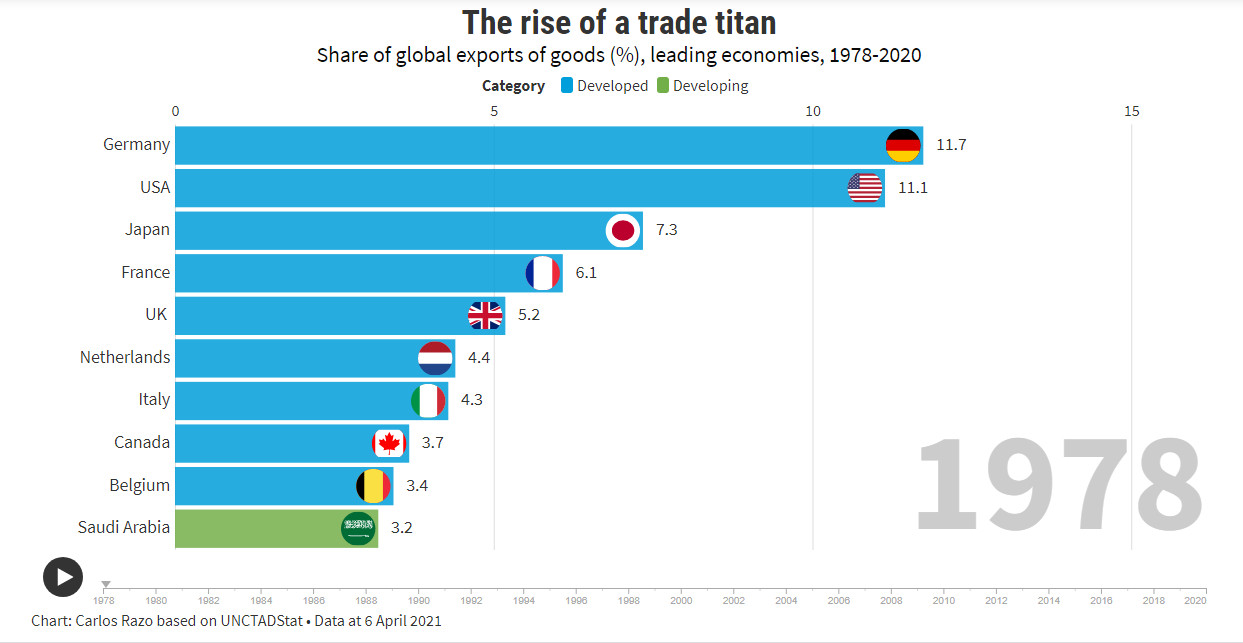
Changing Pattern of Trade - 1978 to 2020
|
1978
|
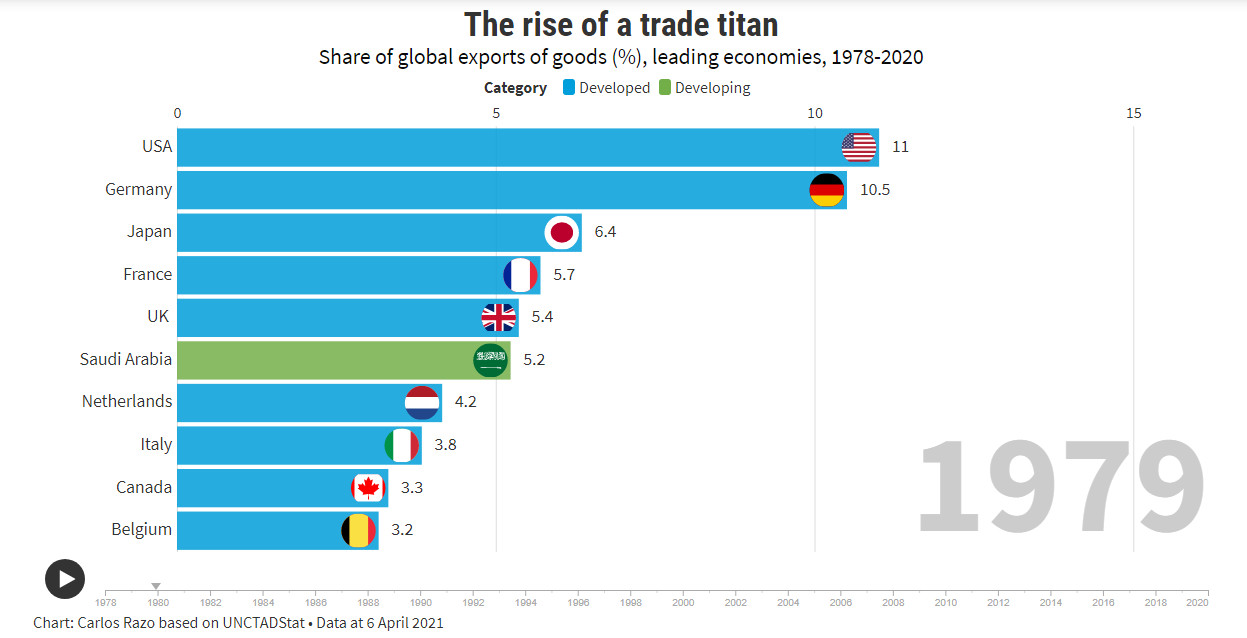
1979
|
|
The USA and Germany are the top exporting countries. OPEC (mainly Saudi Arabia) has disrupted global manufacturing with much higher cost energy.
|
1980
Data Missing
|
1981
Data Missing
|
|
|
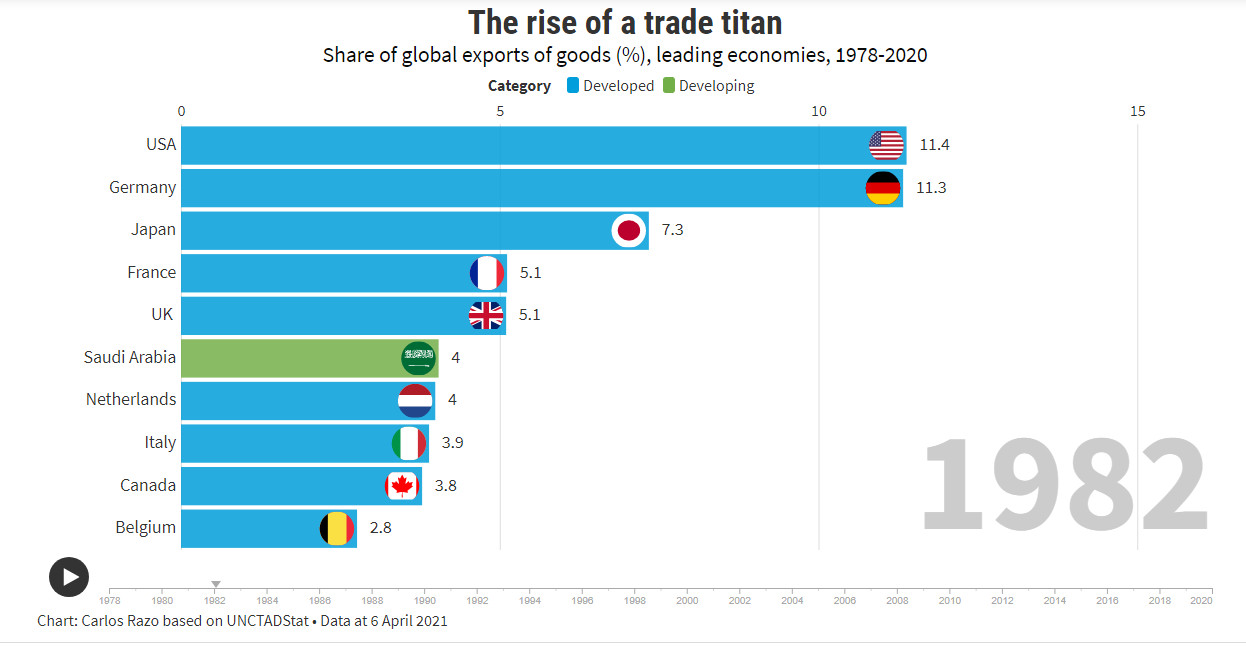
1982
|
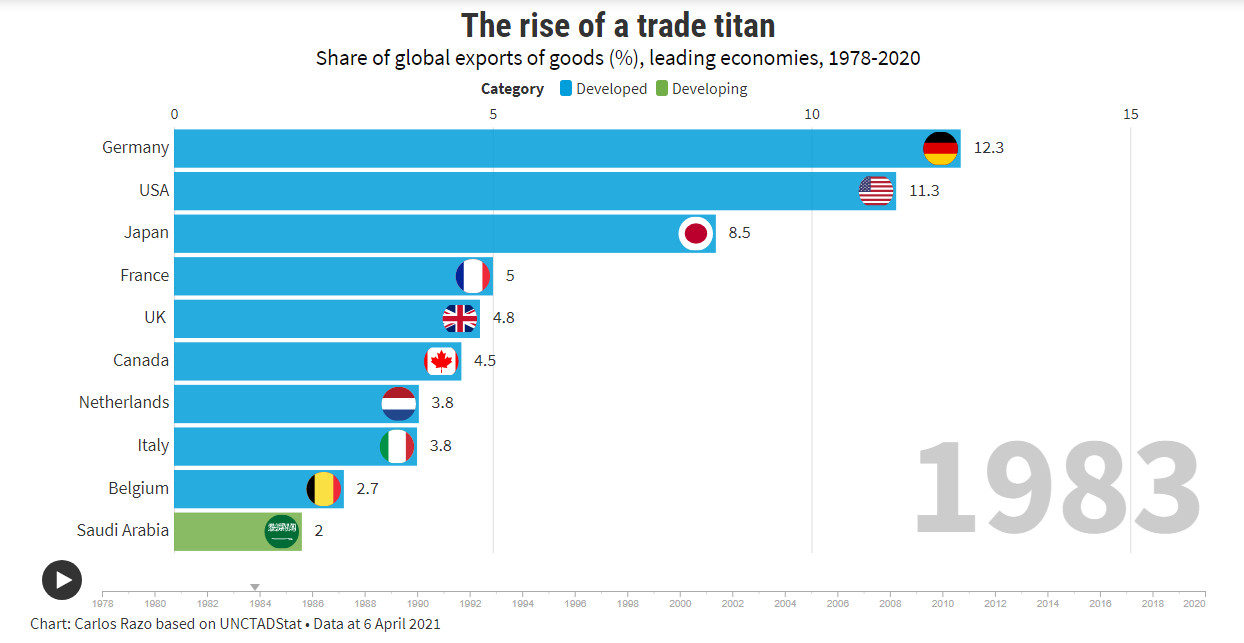
1983
|
|
The USA and Germany are still the top exporting countries. Japan is rising.
|
1984

|
1985

|
|
USA dropping relative to both Germany and Japan mainly because USA has higher costs through very inefficient use of energy. Low cost Asian manufacturing emerges in top 10 for the first time.
|
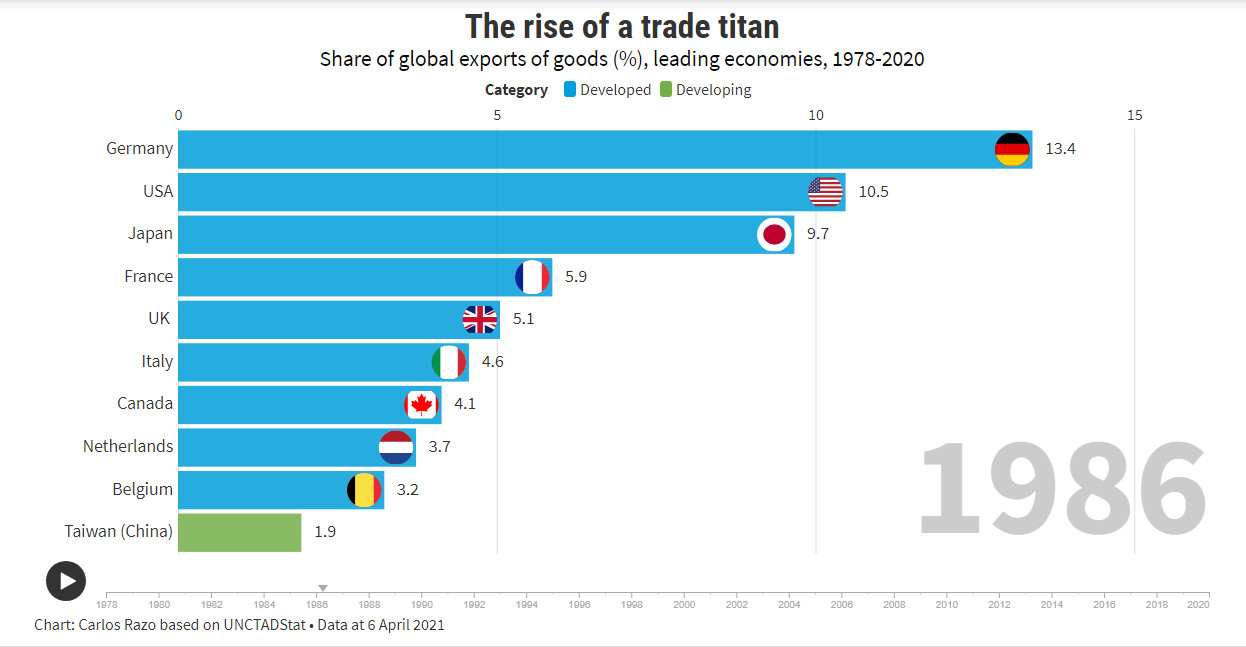
1986
|
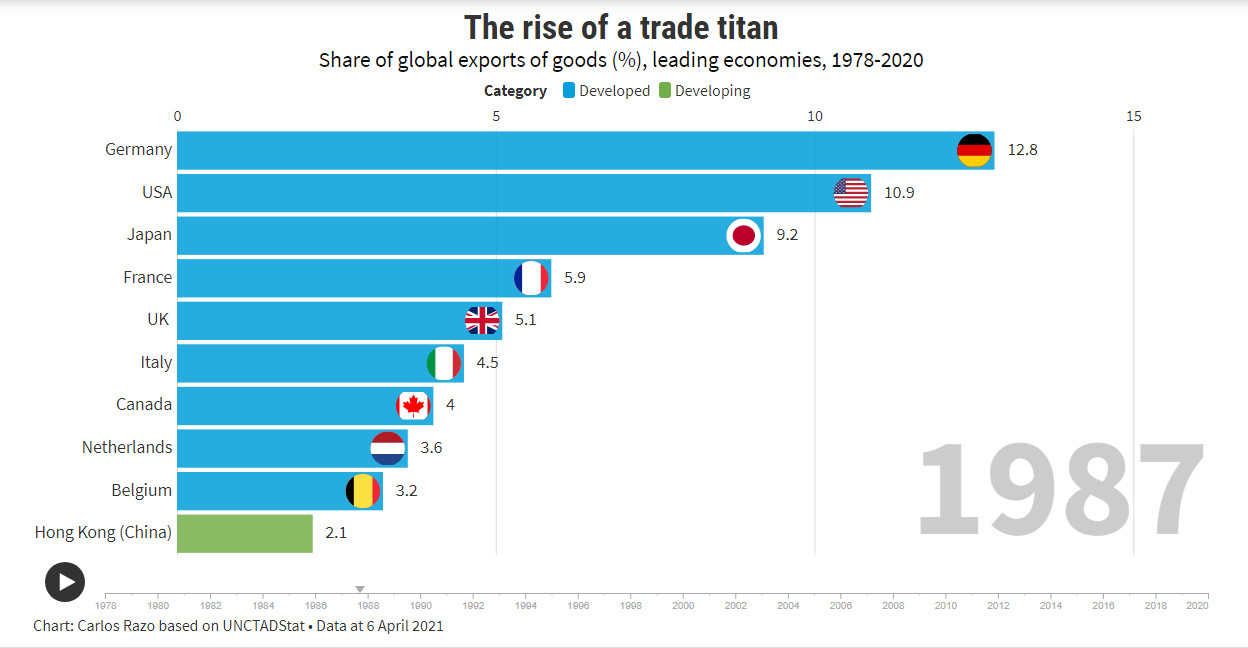
1987
|
|
Germany, USA and Japan dominating global exports.
|
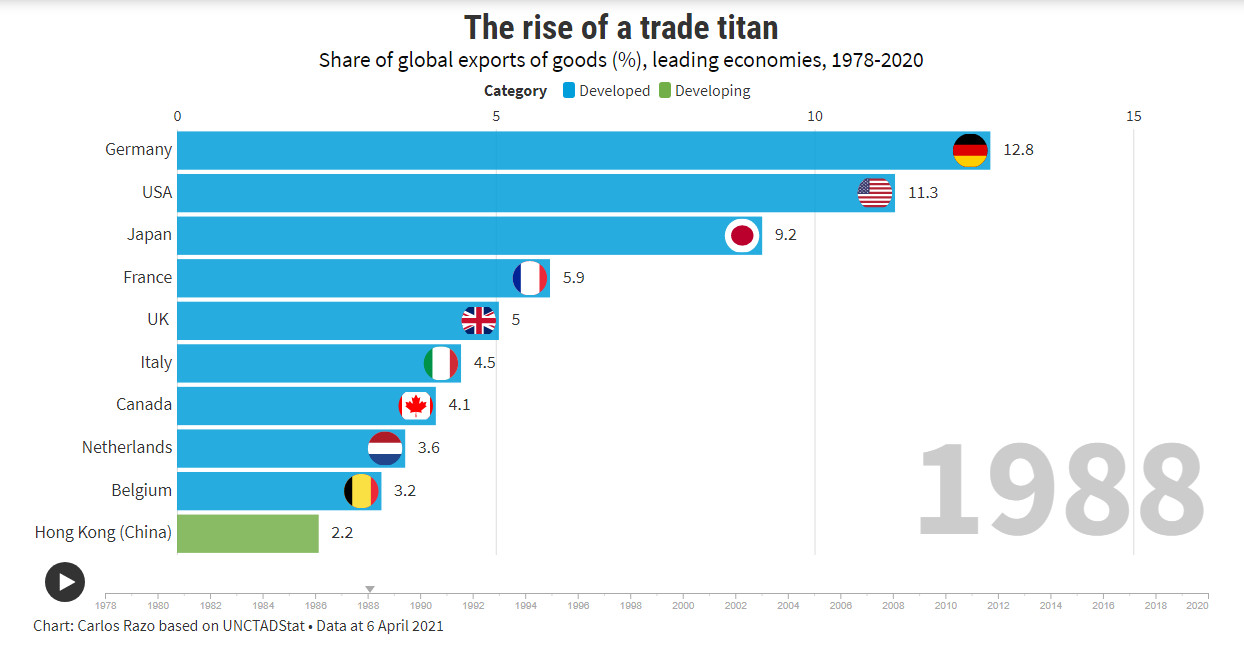
1988
|
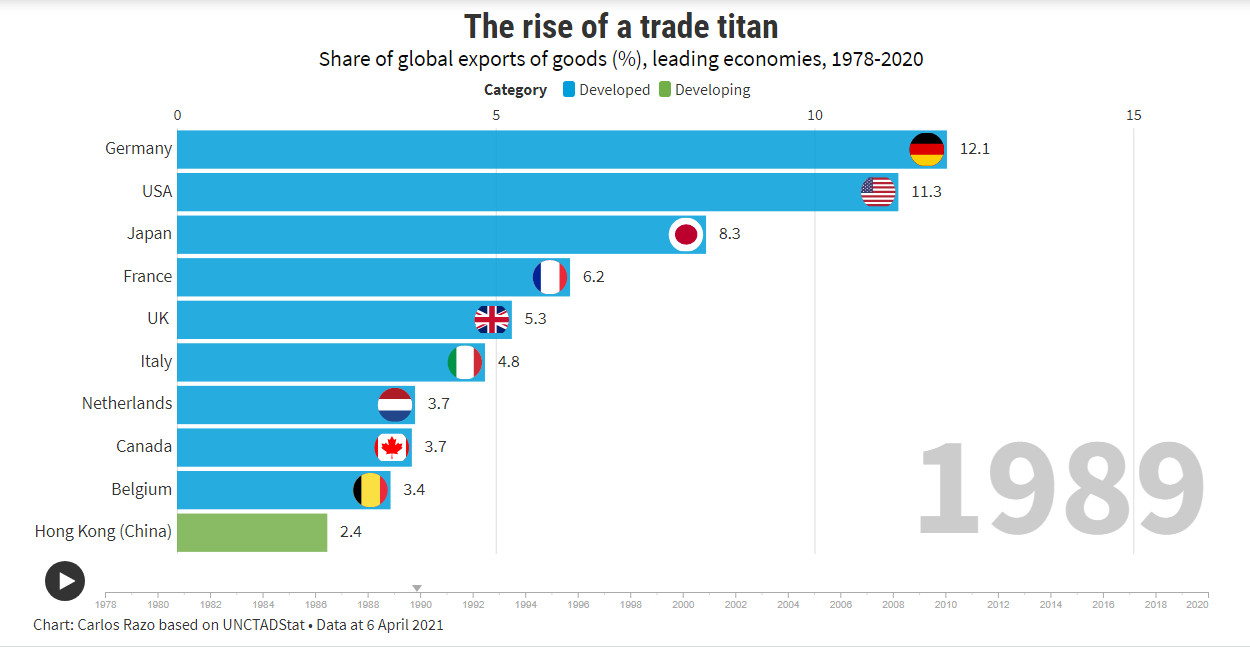
1989
|
|
Germany, USA and Japan still dominating global exports.
|
1990

|
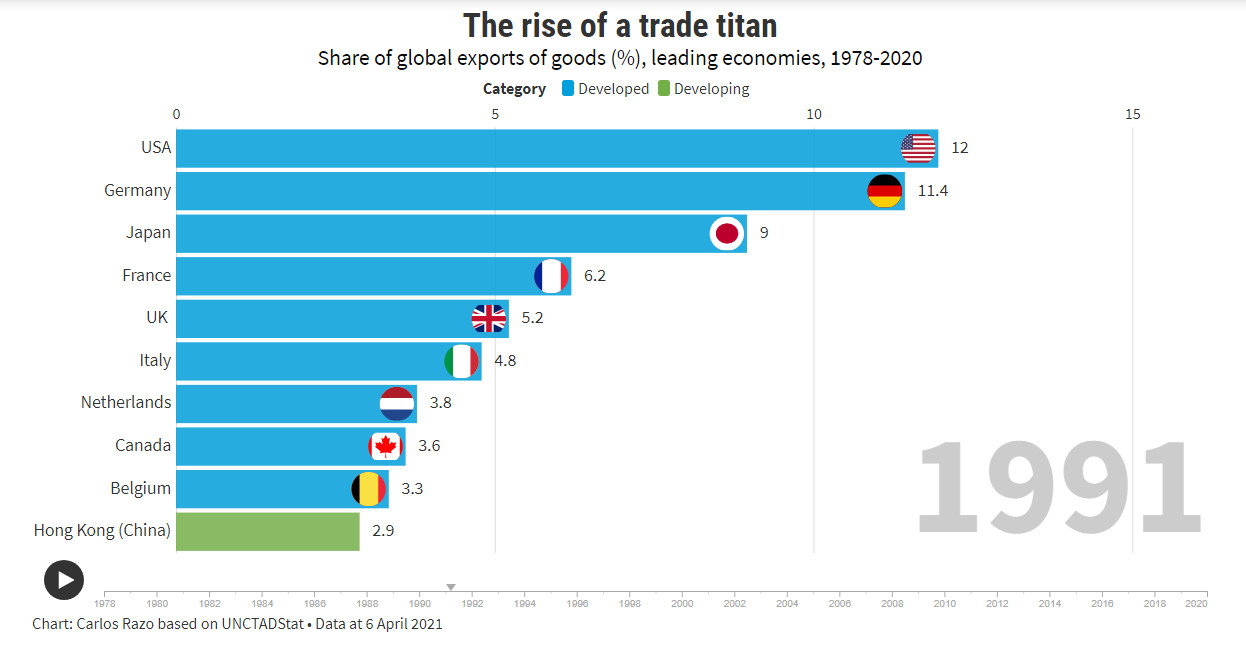
1991
|
|
Germany, USA and Japan still dominating global exports.
|
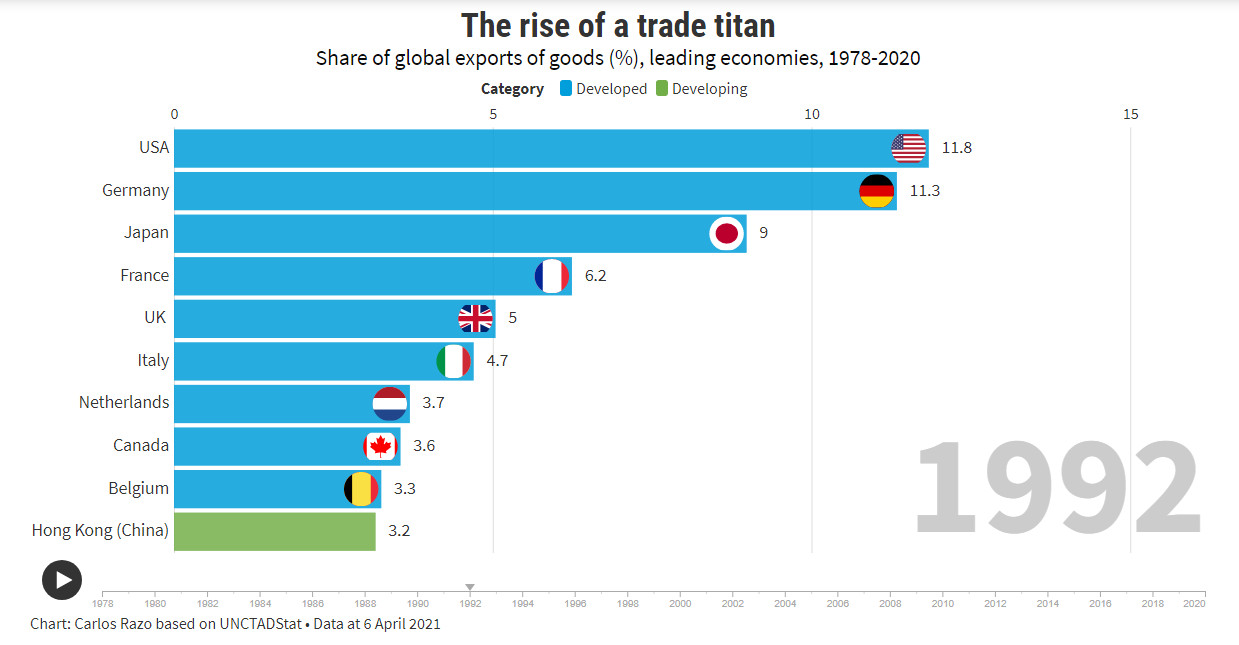
1992
|
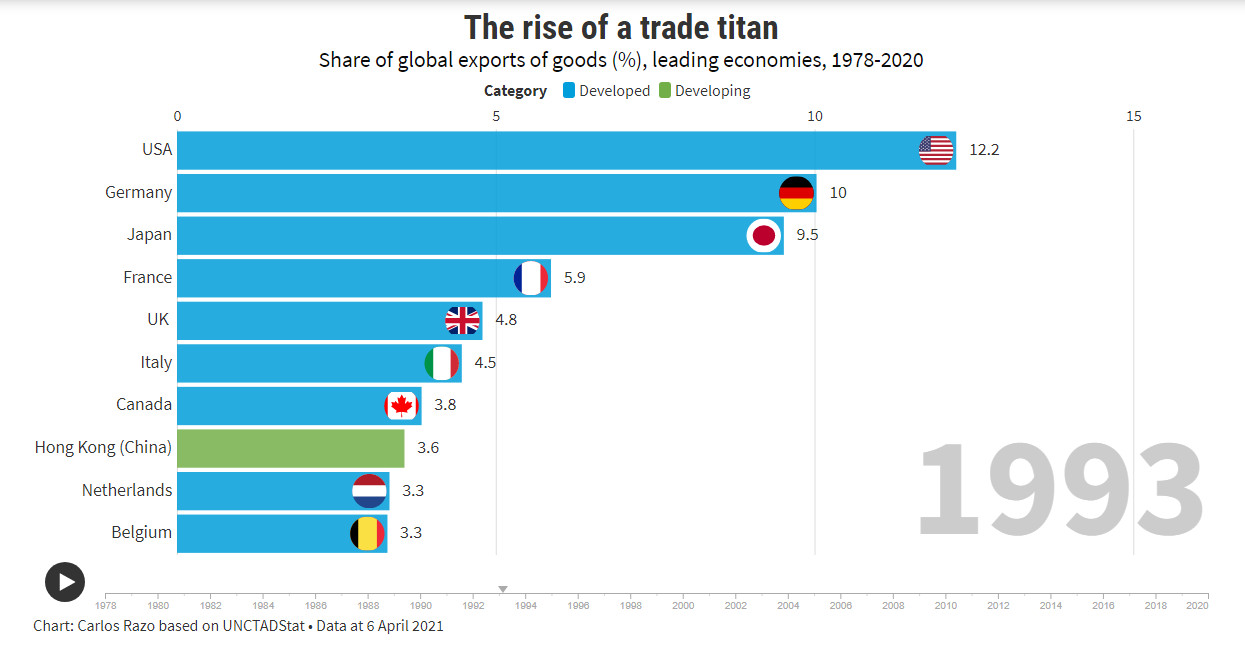
1993
|
|
Germany, USA and Japan still dominating global exports.
|
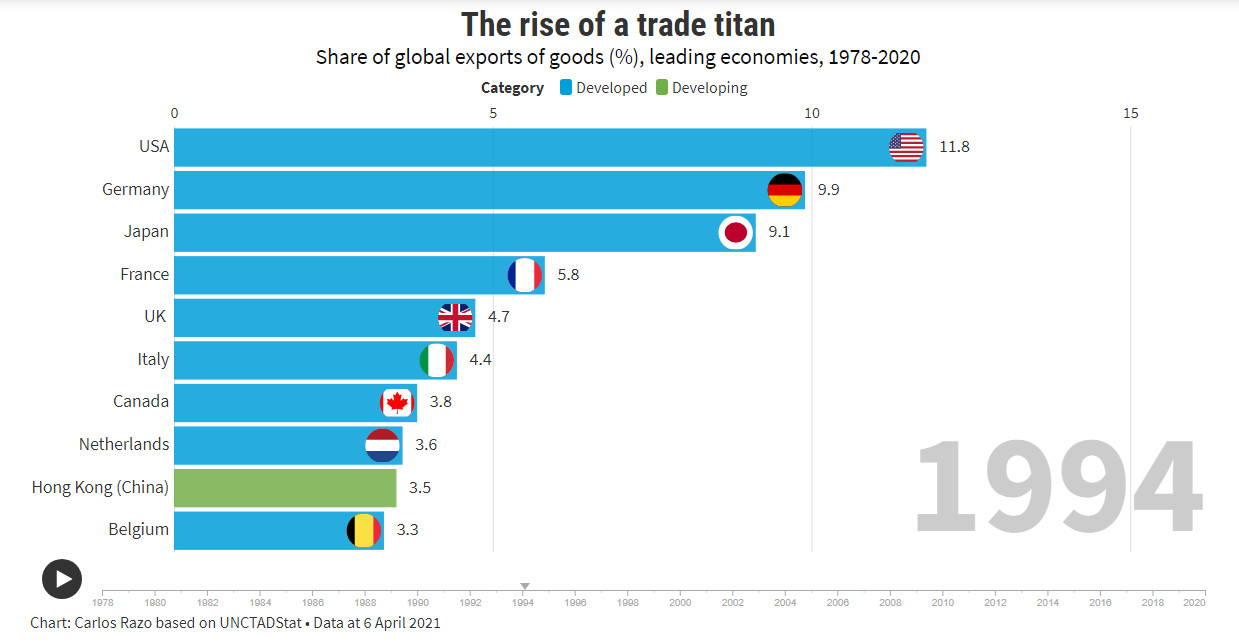
1994
|
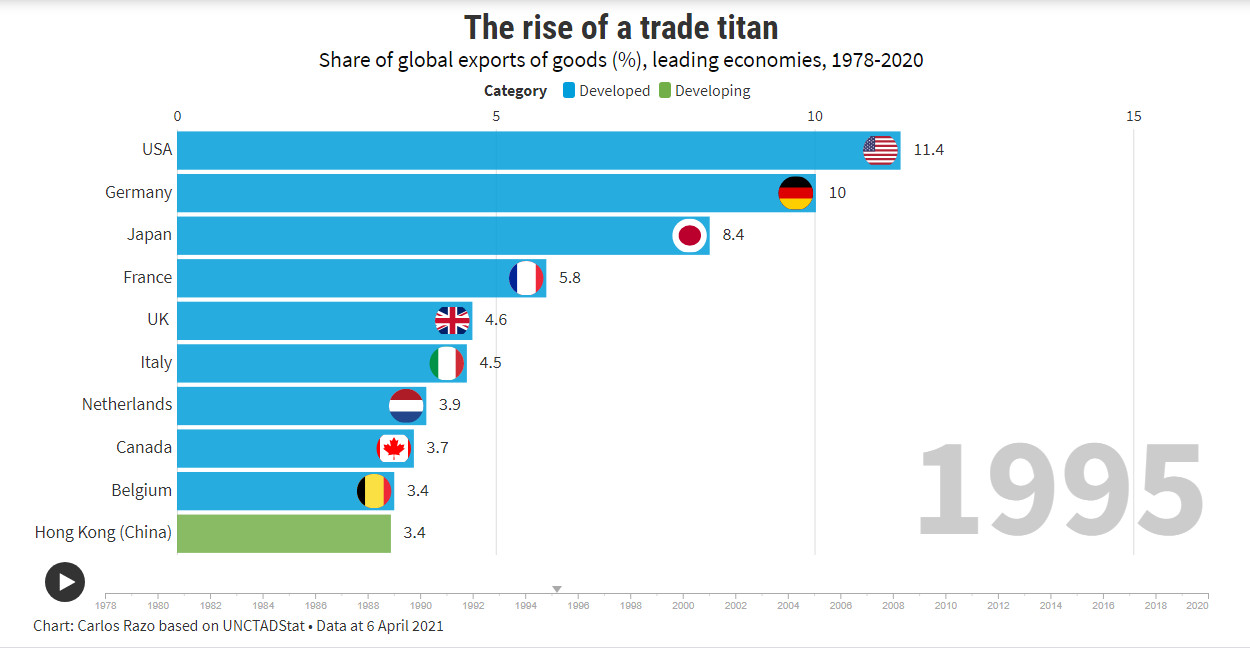
1995
|
|
Germany, USA and Japan still dominating global exports.
|
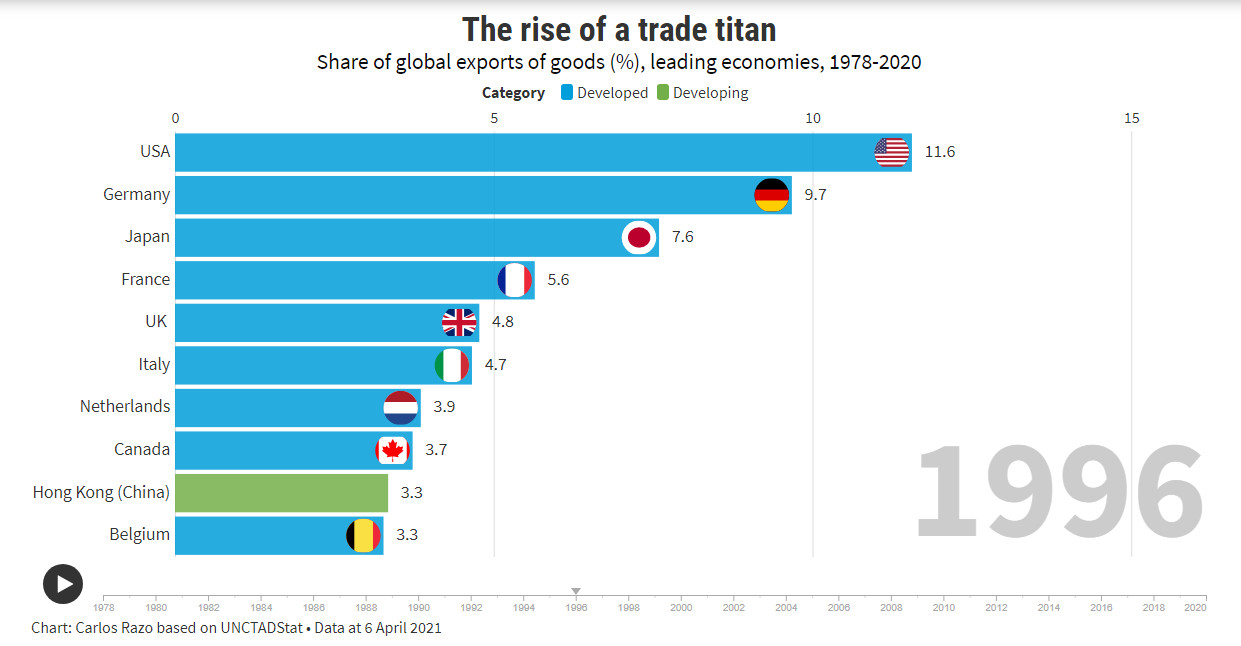
1996
|
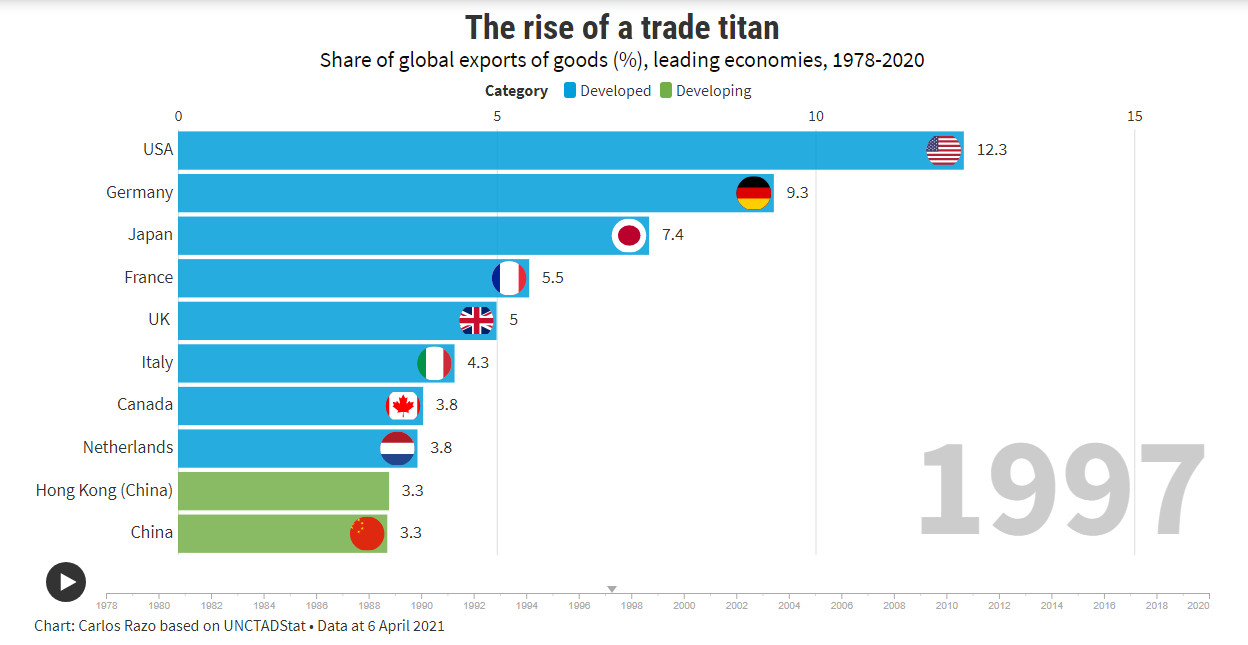
1997
|
|
Germany, USA and Japan still dominating global exports. In 1997 China appears in top 10 exporting countries for first time.
|
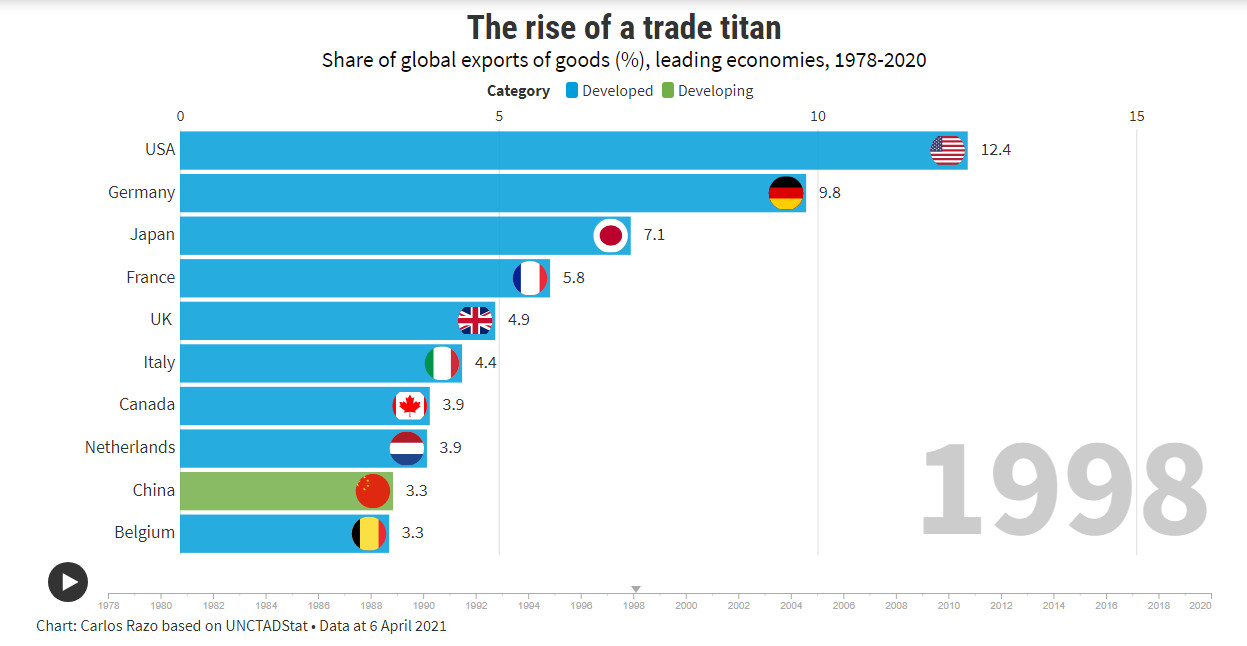
1998
|
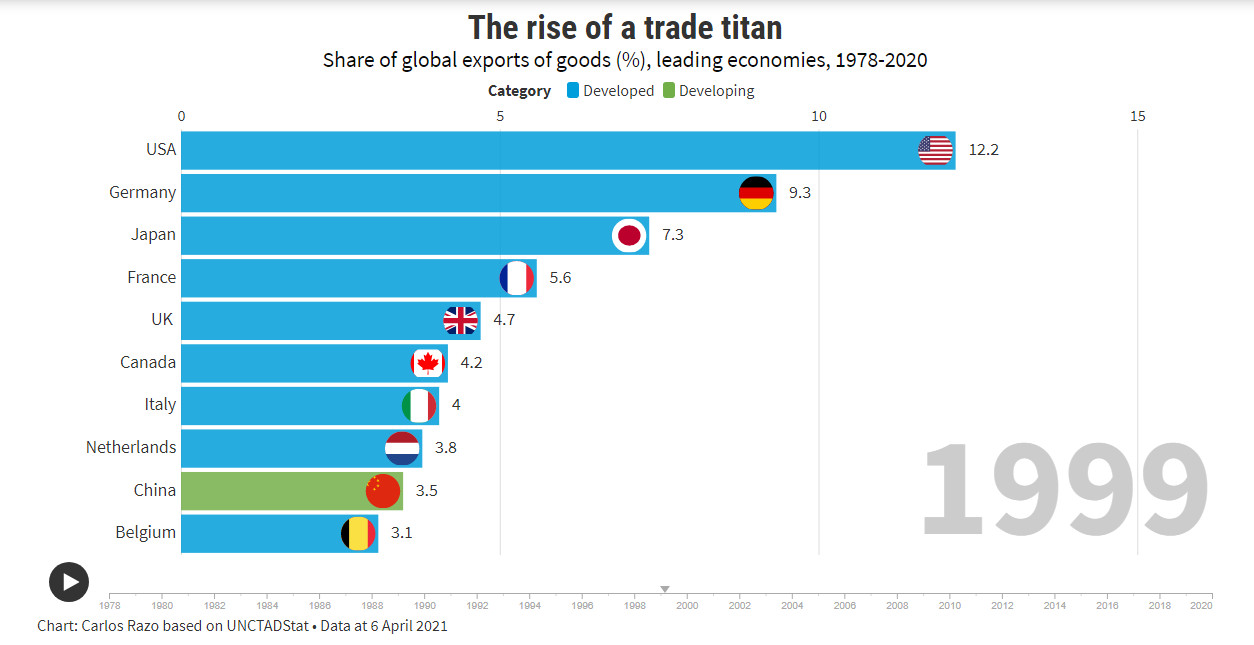
1999
|
|
Germany, USA and Japan still dominating global exports.
|
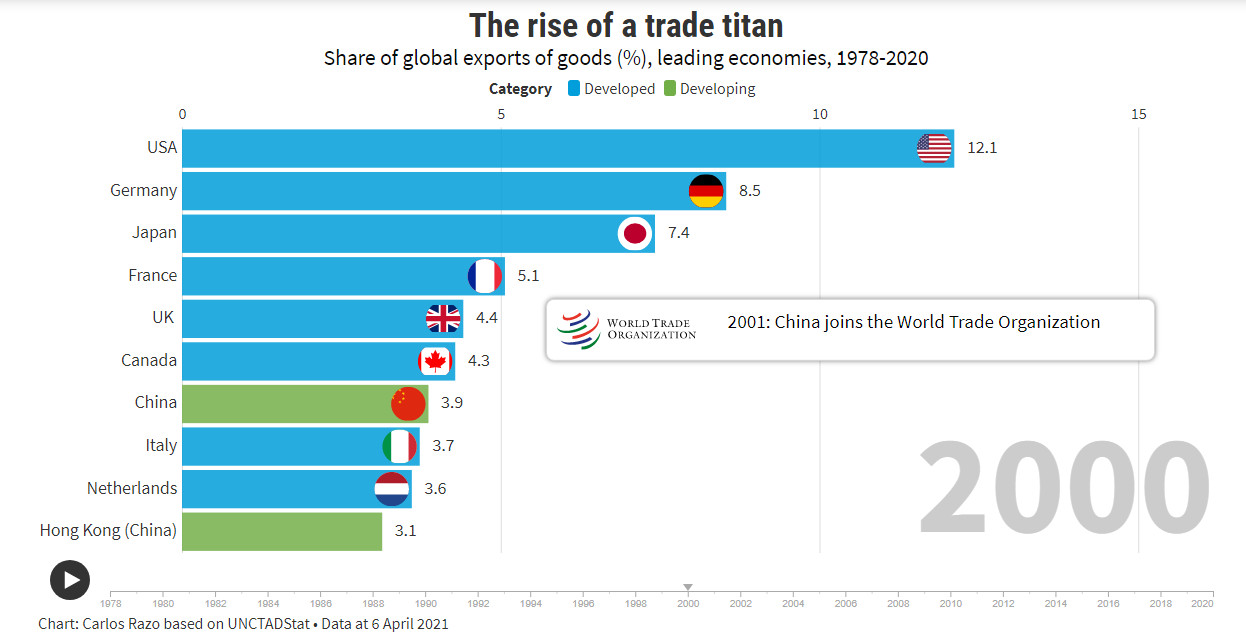
2000
|
2001
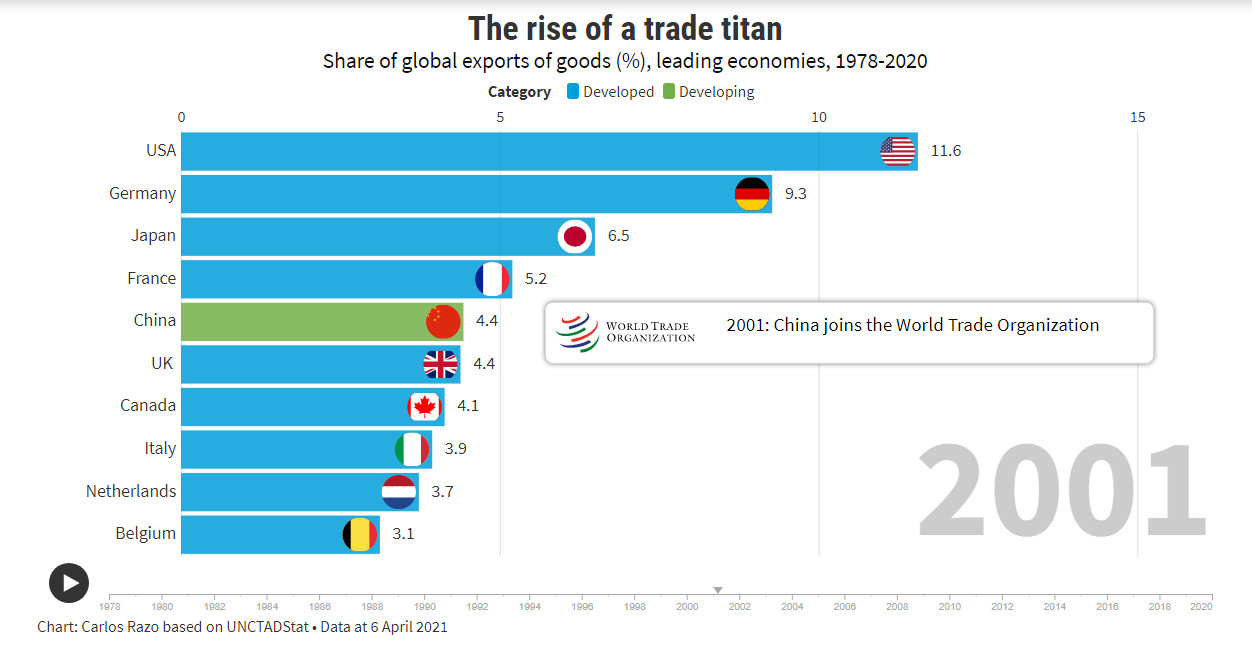
|
|
Germany, USA and Japan still dominating global exports.
|
|
2000
|
2001
|
|
Germany, USA and Japan still dominating global exports.
|
2002
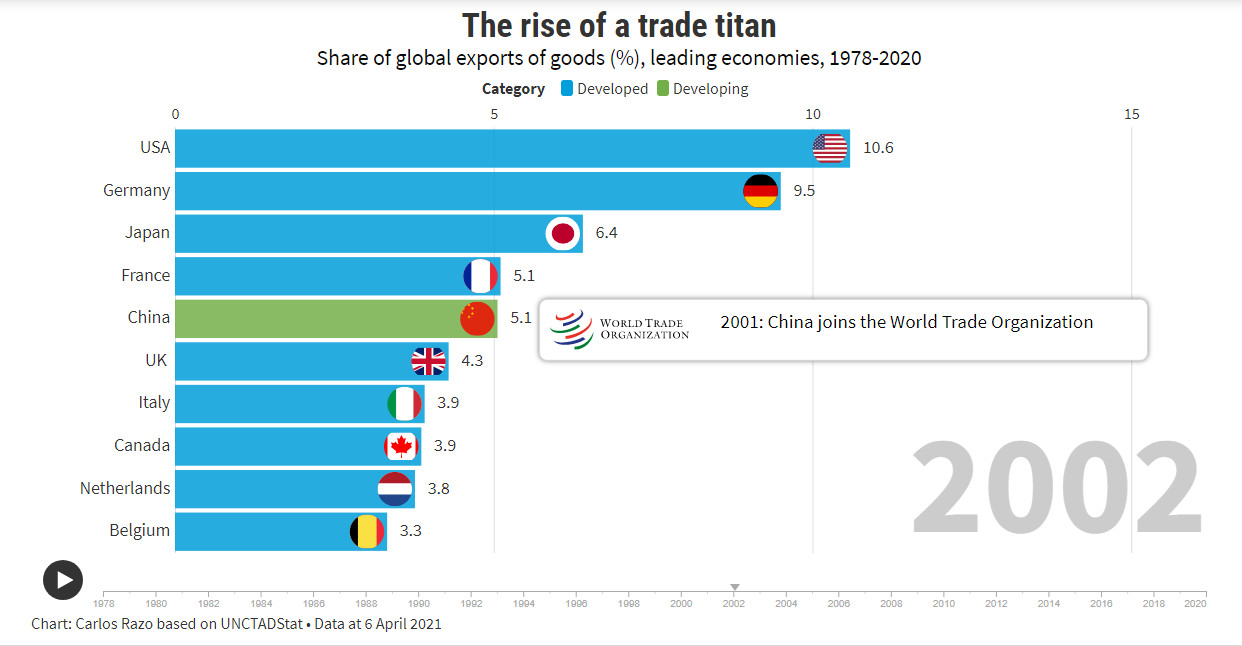
|
2003
|
|
Germany, USA and Japan still dominating global exports. China rapidly expanding export volume.
|
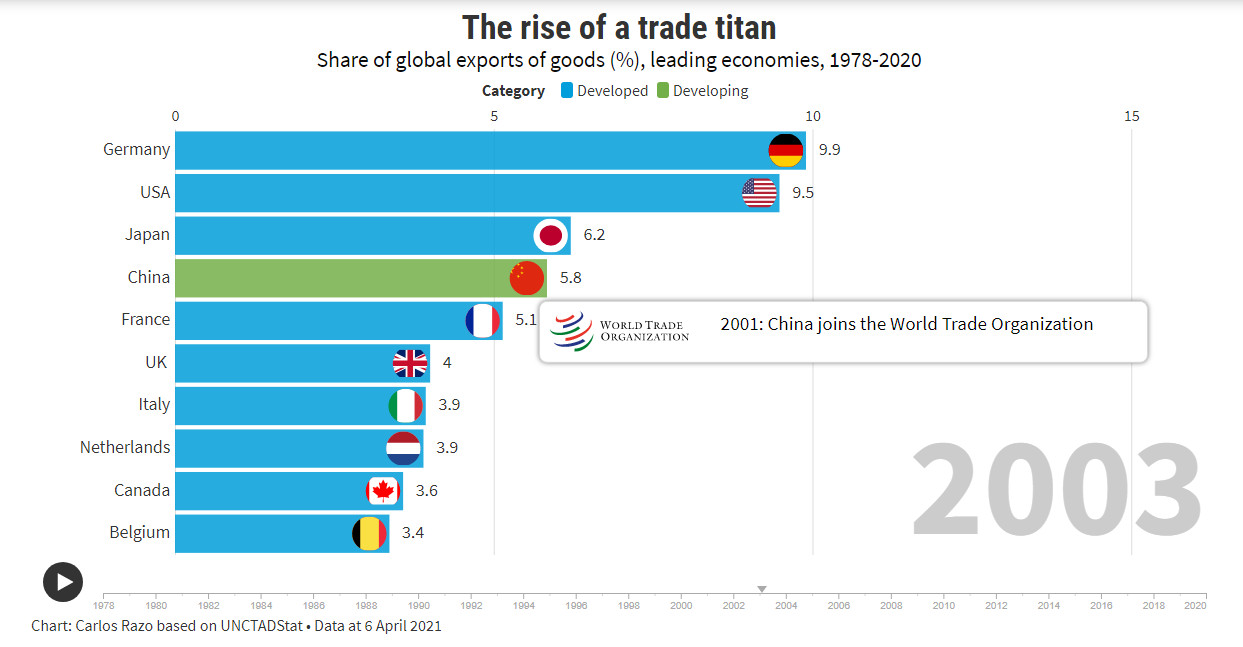
2004
|
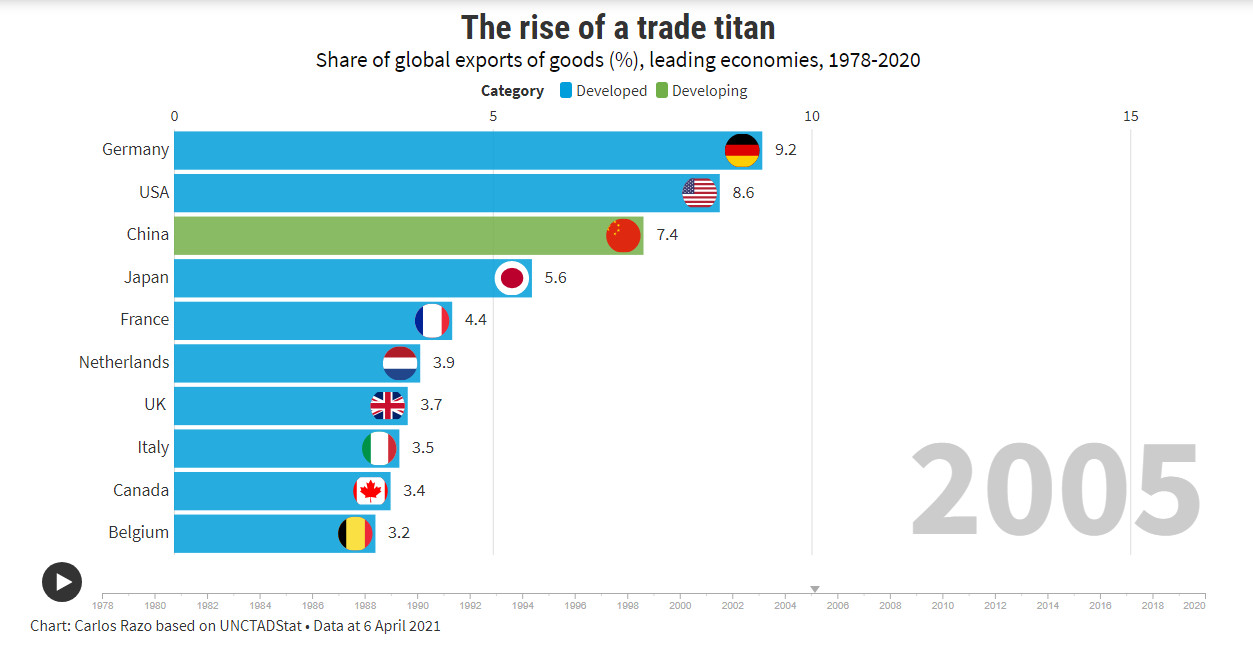
2005
|
|
Germany, USA and China become top 3 in global exports. China displaces Japan.
|
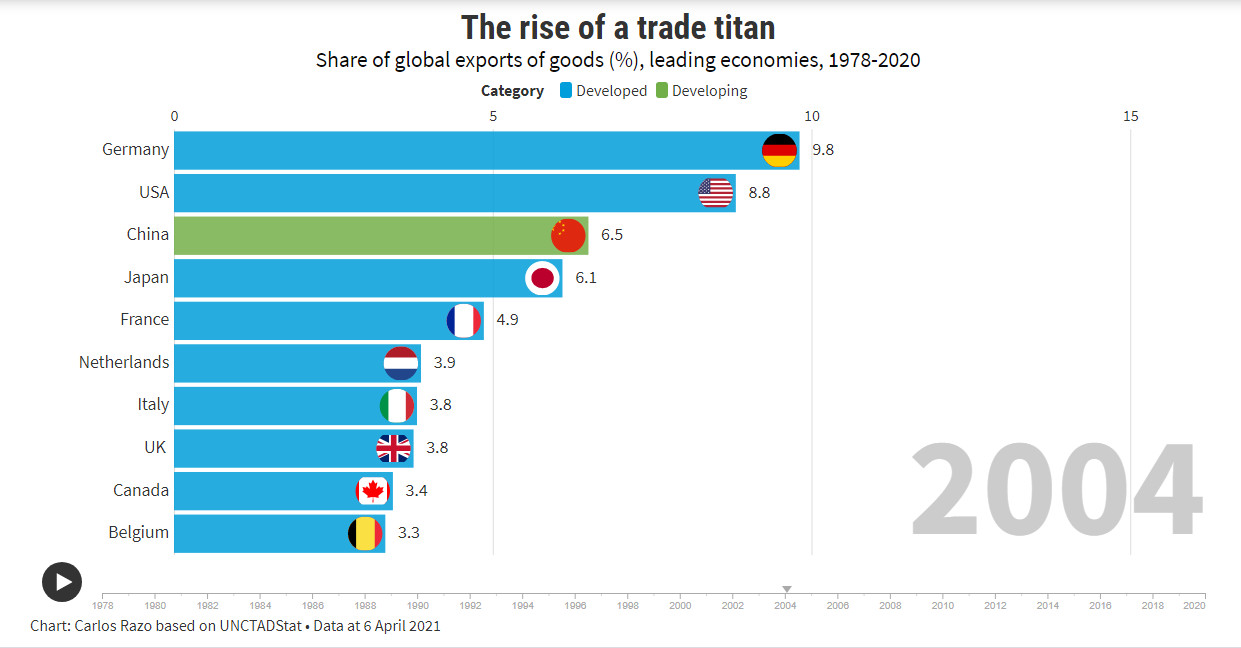
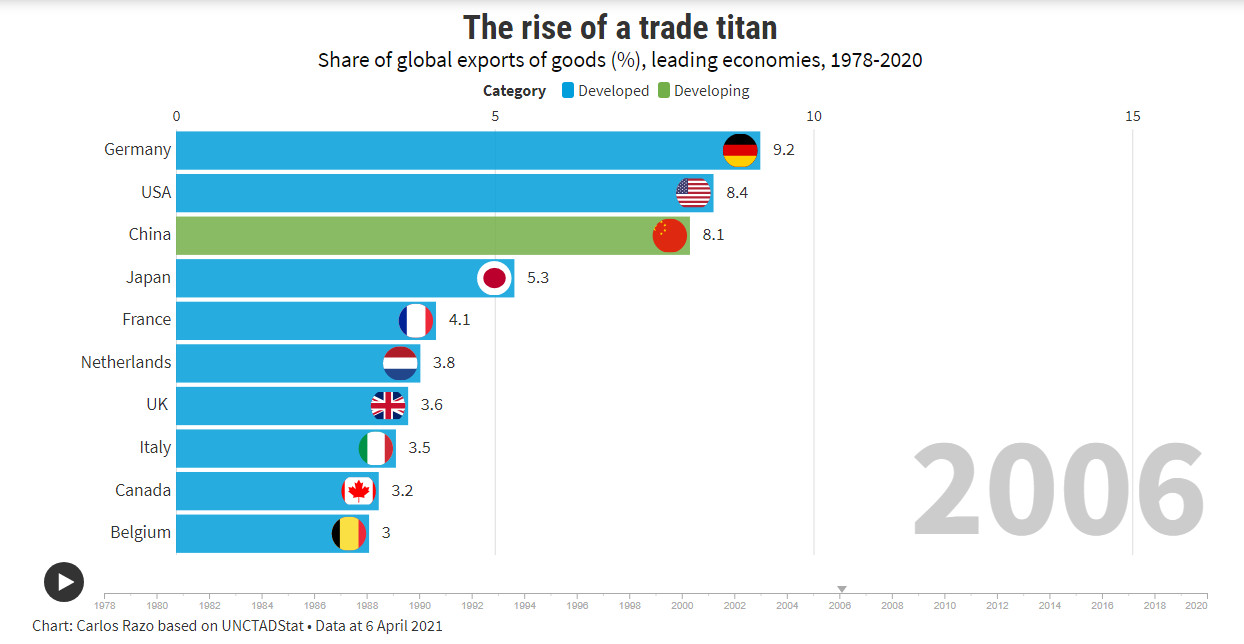
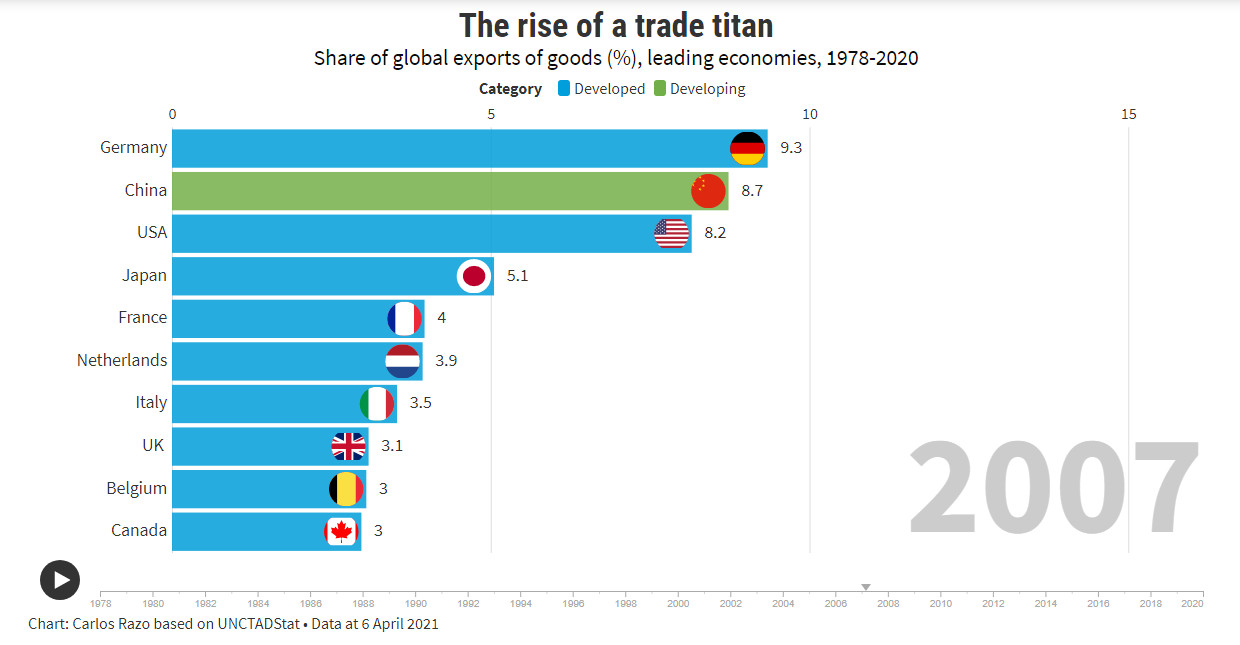
2006
|
2007
|
|
Germany, USA and China now dominating global exports.
|
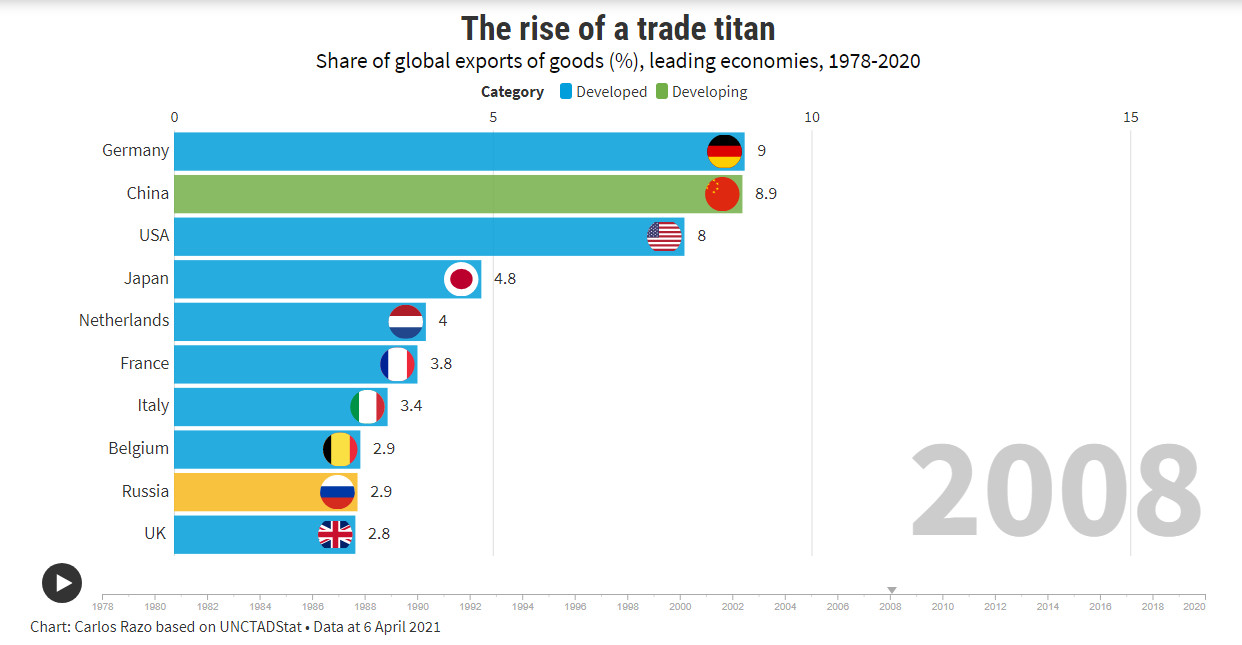
2008
|
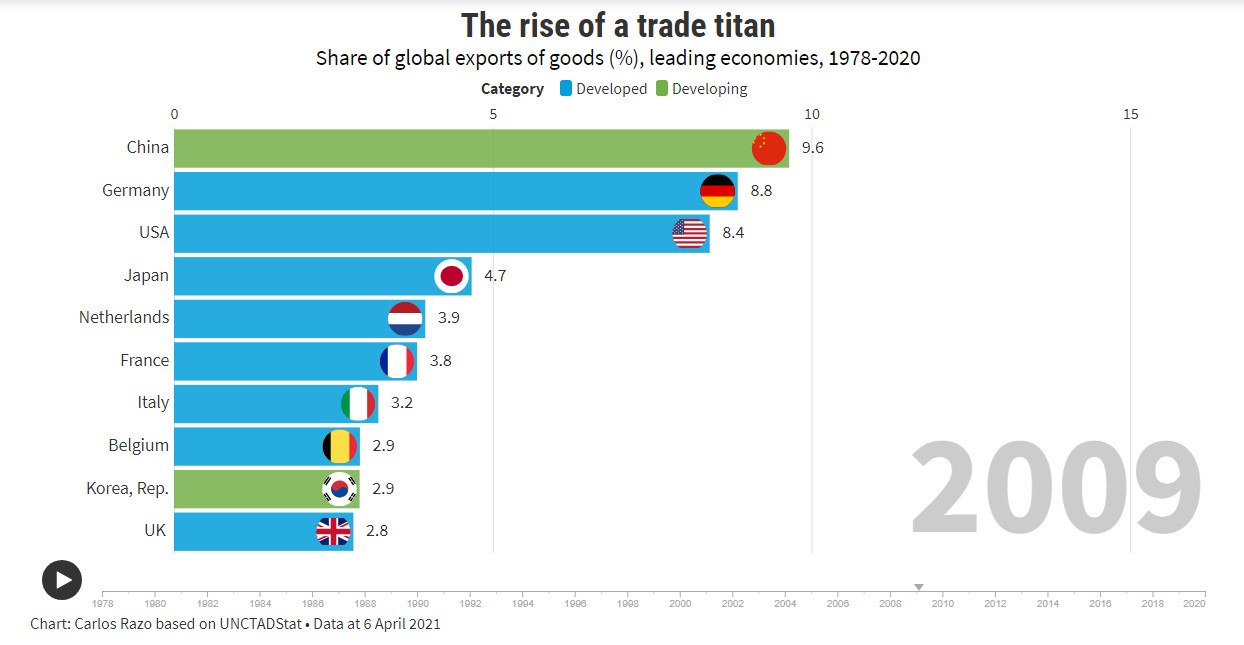
2009
|
|
Financial crisis of 2008 disrupts global trade and Russia appears in top 10 exporters. In 2009 China becomes largest exporter. Together China, Germany and USA dominate global exports.
|
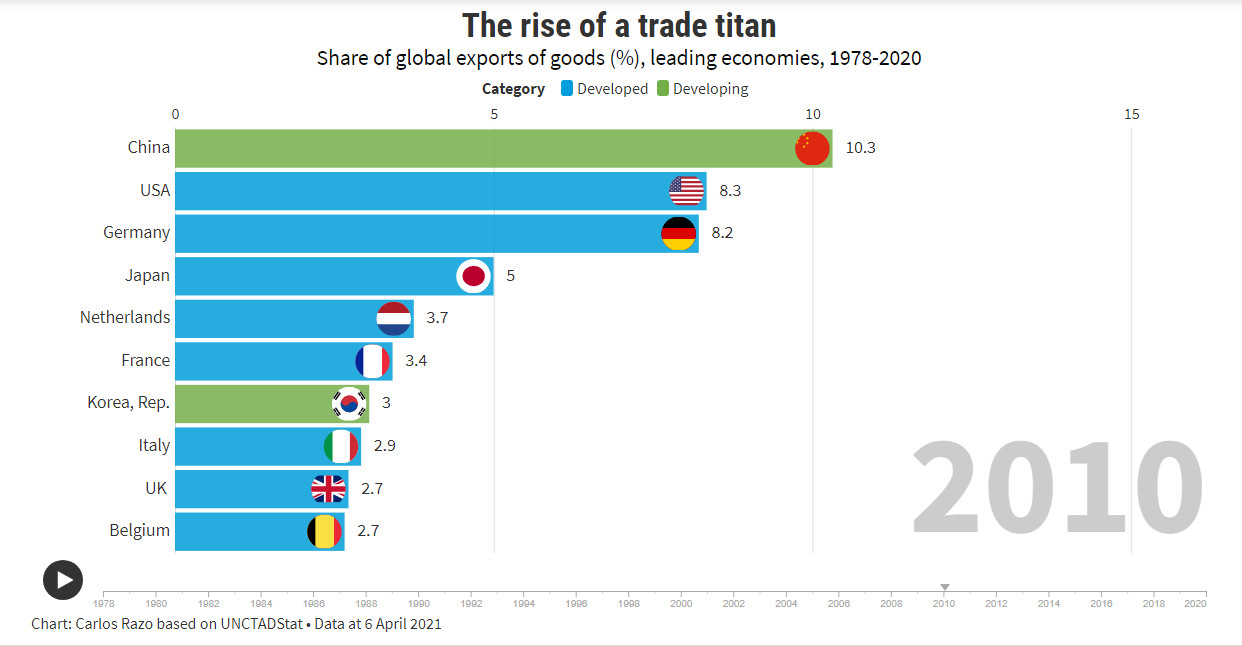
2010
|
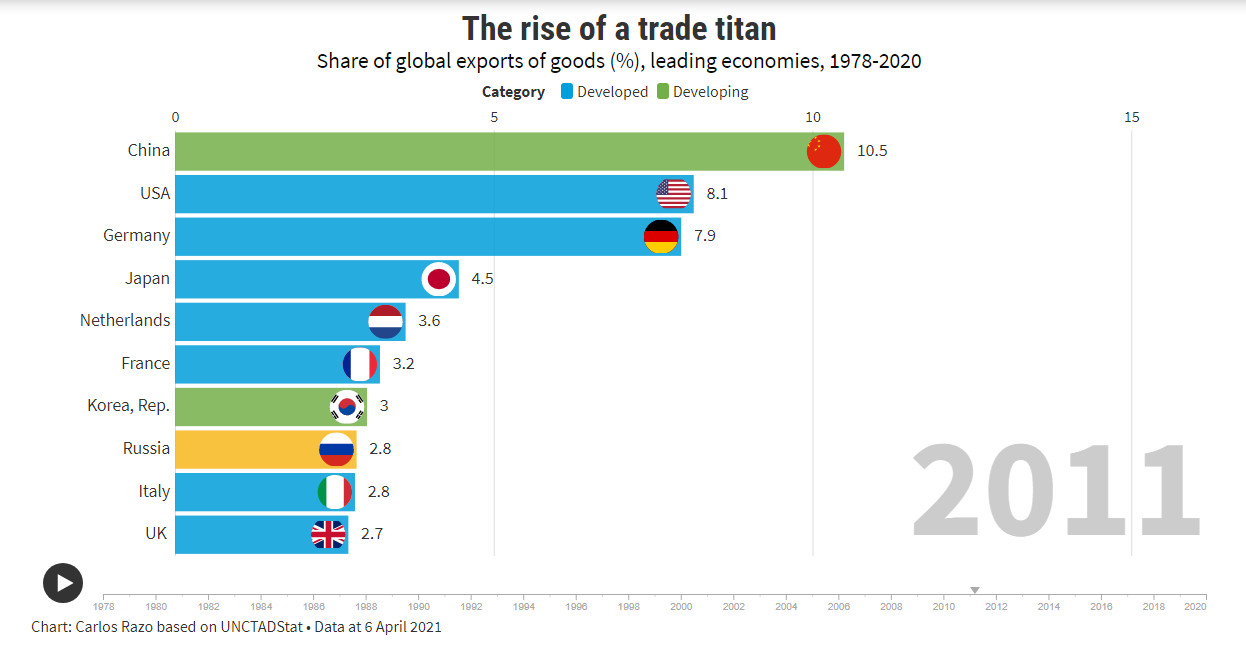
2011
|
|
China increases its domination of global exports. USA and Germany decline relative to China.
|
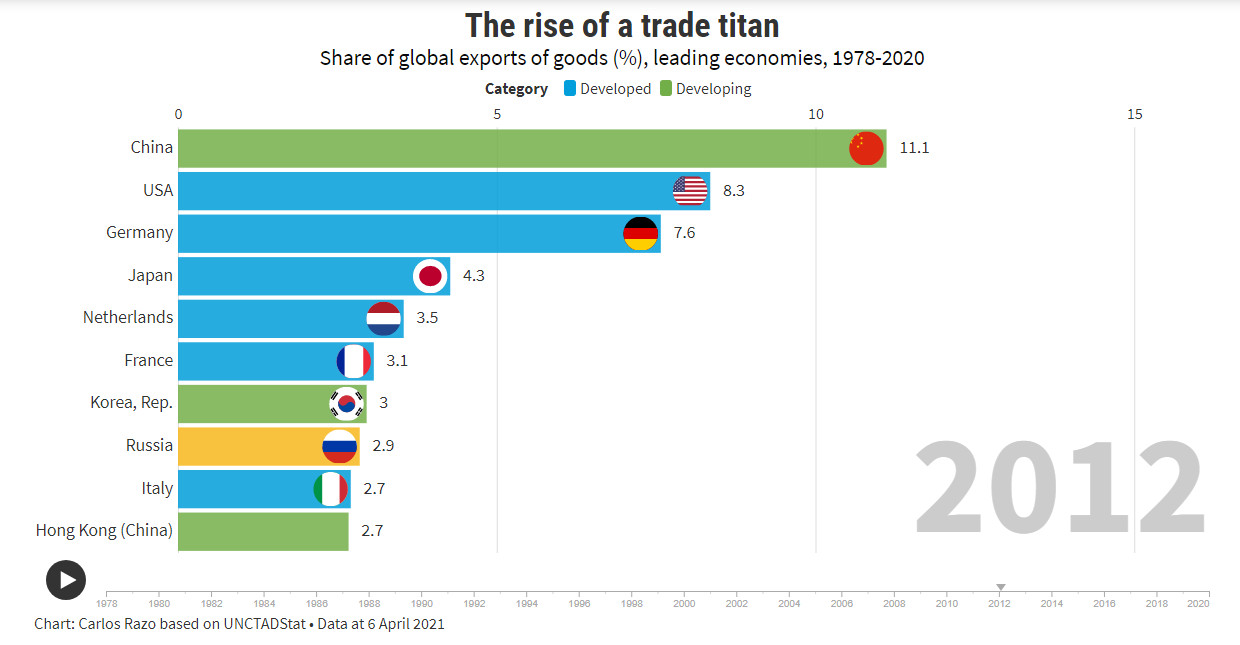
2012
|
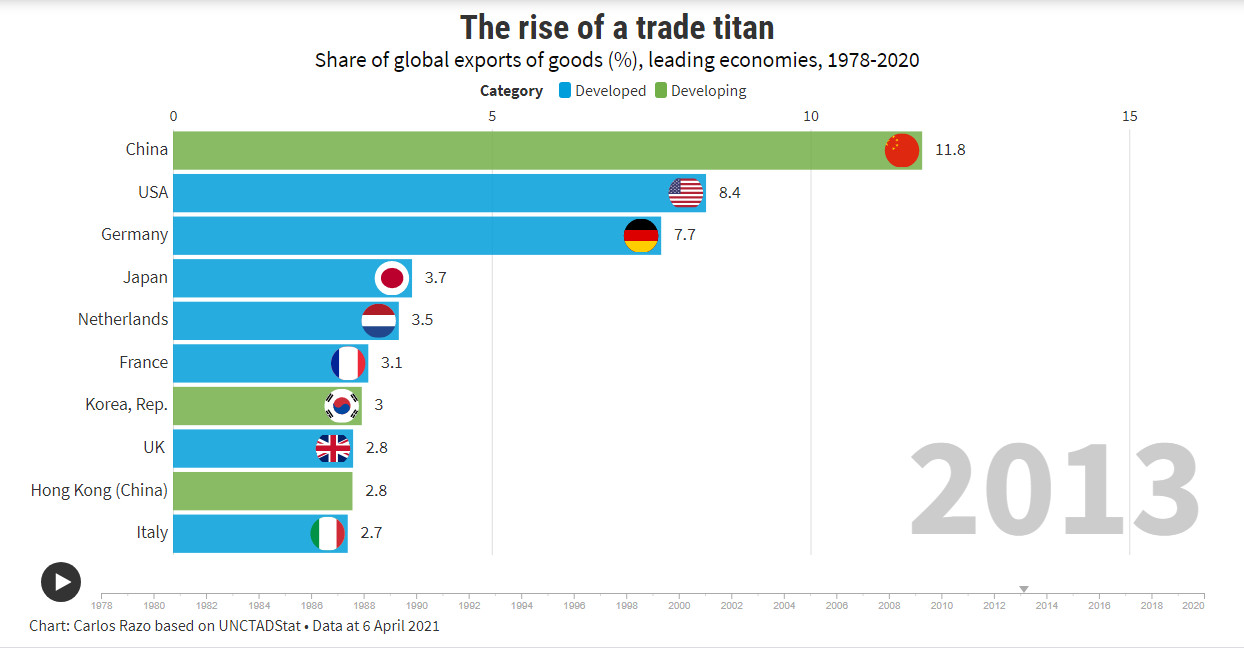
2013
|
|
China increases its domination of global exports. USA and Germany decline relative to China. Asian area countries ... China, Japan, Hong Kong (China) and S. Korea are together the largest block of exporting countries.
|
2014
|
2015
|
|
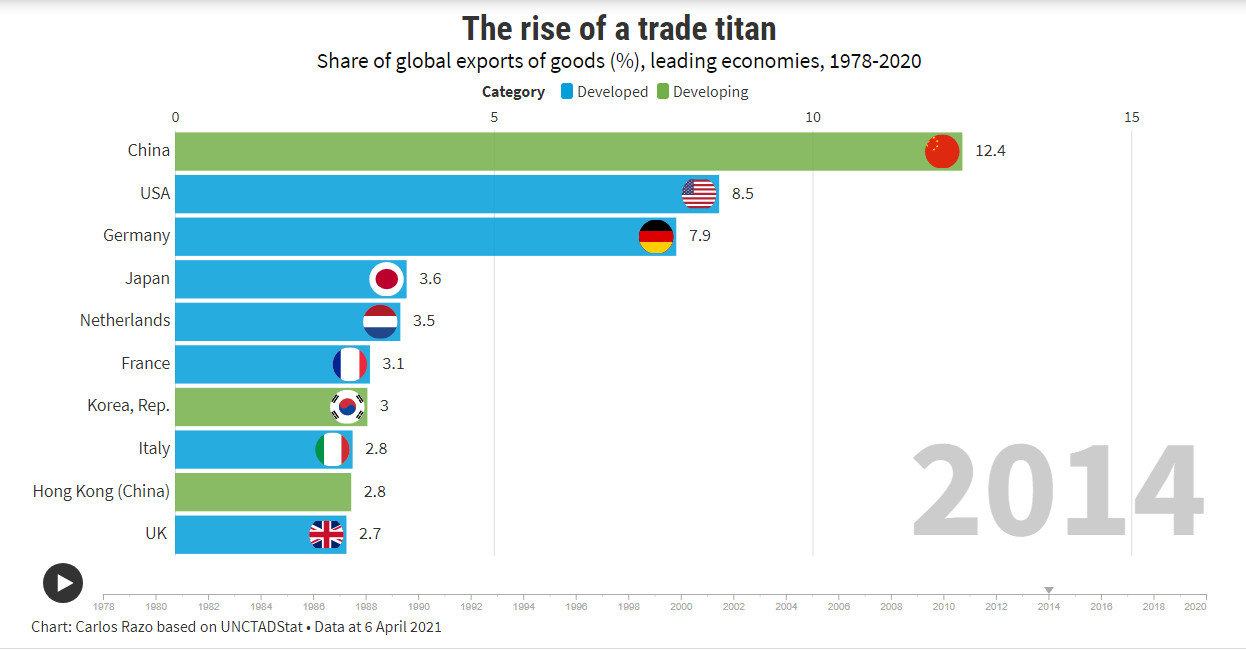
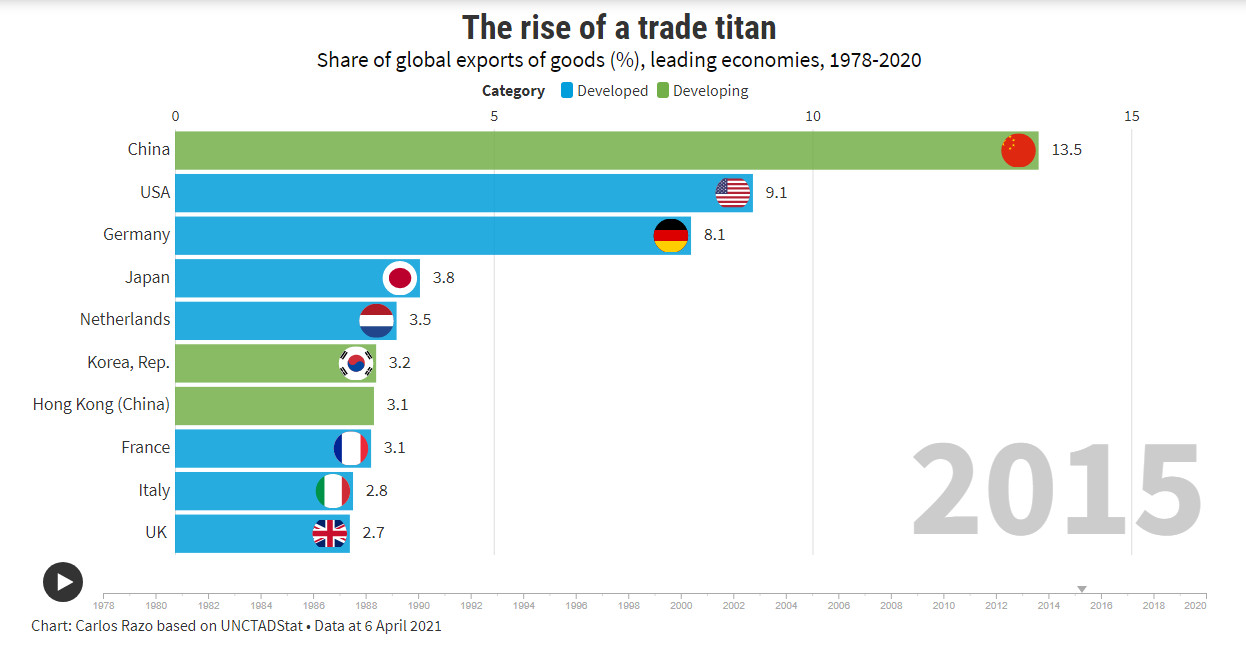
China increases its domination of global exports. USA and Germany decline relative to China.
|
2016
|
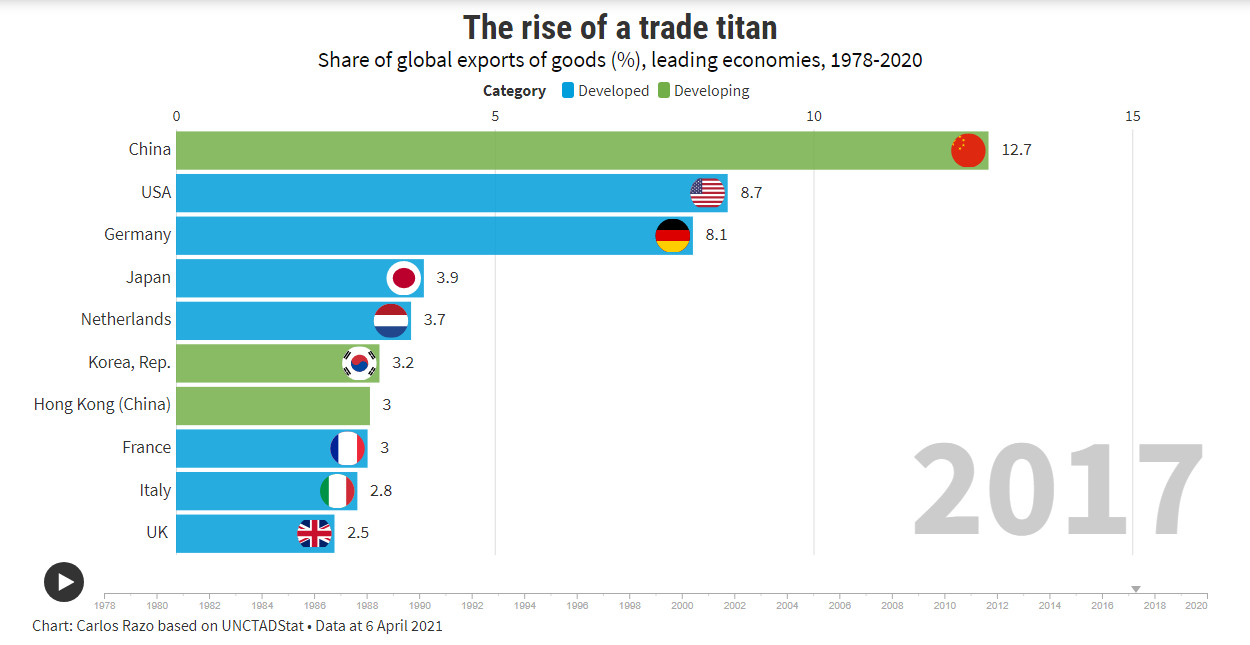
2017
|
|
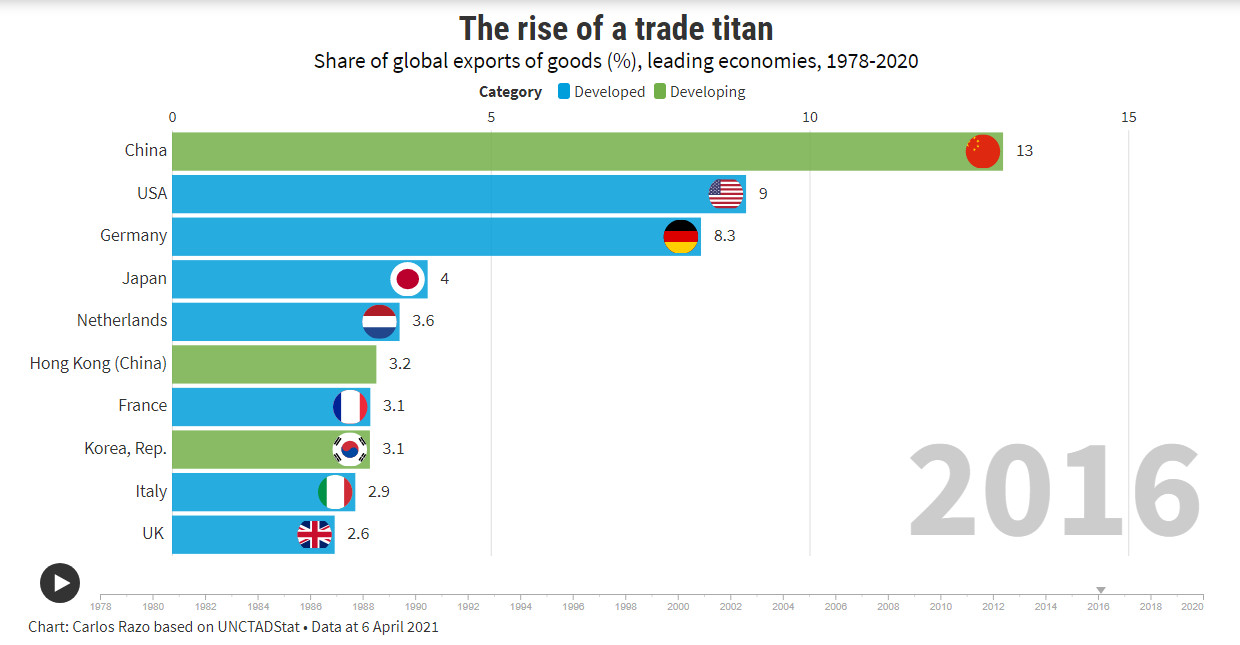
China increases its domination of global exports. USA and Germany decline relative to China.
|
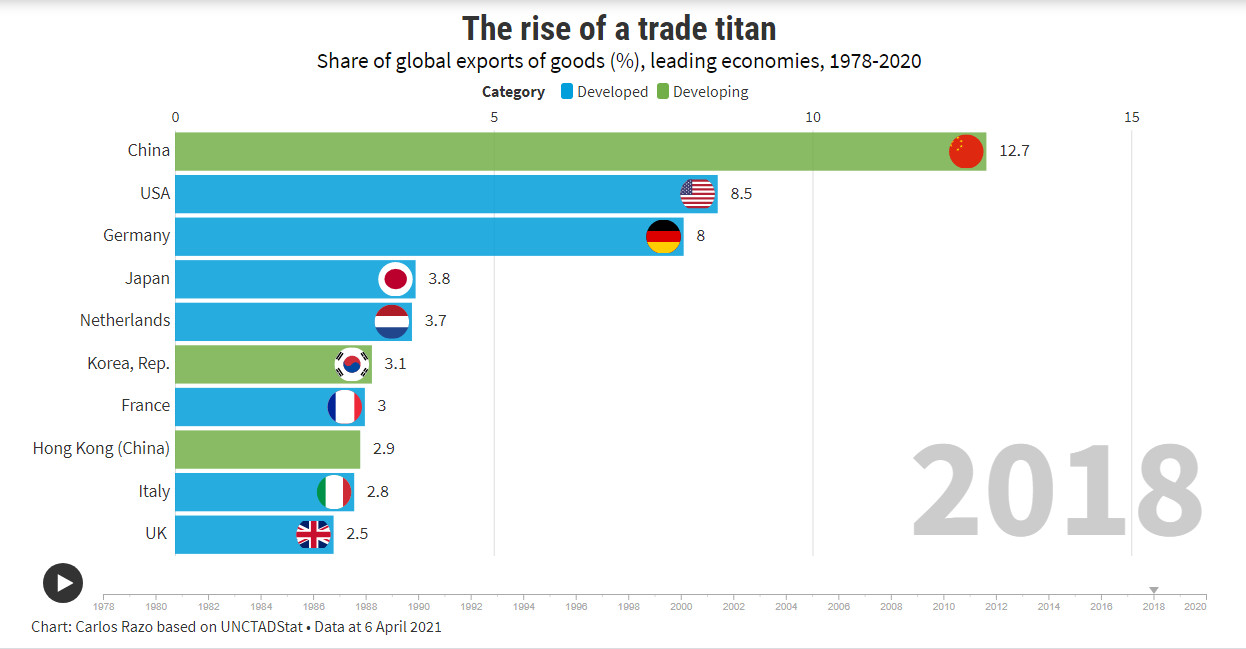
2018
|
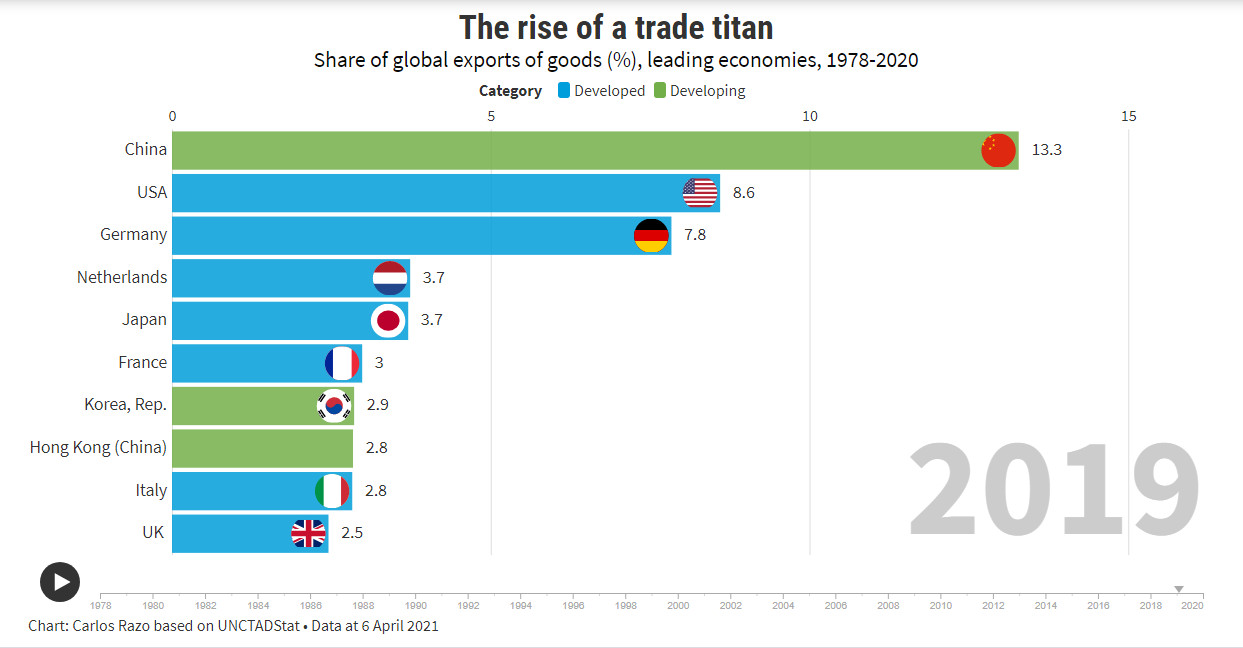
2019
|
|
China increases its domination of global exports. USA and Germany decline relative to China.
|
|
2020
|
2021

|
|
China increases its domination of global exports. USA and Germany decline relative to China.
|