
Date: 2024-04-29 Page is: DBtxt003.php txt00005736
Agriculture
Fertilizer Industry
Some data concerning the fertilizer industry
Burgess COMMENTARY
Peter Burgess
A First Look at the Fertilizer Industry
Demand for staples and meat has grown with the global population and rising incomes in developing countries, which has resulted in higher demand for fertilizers. Here’s a brief snapshot of the trends in the fertilizer industry

fertilizer-cover
Fertilizers account for up to two-thirds of the agricultural chemicals industry. Currently, China is the biggest consumer and producer of fertilizers in the world, with 55.6 million tons consumed in 2010. With $16.5 billion worth of fertilizers imported in 2010, the US is the biggest importer. Russia is the largest exporter, with $27 billion worth of fertilizers exported in the same year.
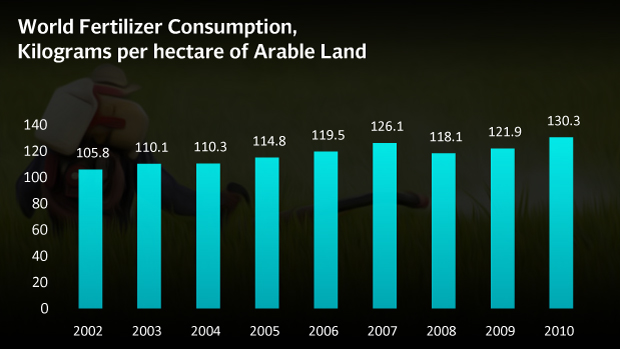
Fertilizer consumption and prices have been in a secular uptrend, with consumption increasing 14.5% over the last five years. The prices of nitrogenous, phosphatic and potash fertilizers slumped following the financial crisis, but have recovered steadily since then.

global-fertilizer-consumption

us-producer-price-index
Agricultural chemicals like fertilizers, insecticides, pesticides and herbicides account for around 25-33% of total crop production costs. Over the past five years, agricultural input costs have displayed a positive correlation with farmers’ incomes, which are a function of crop prices. This affects the demand for fertilizers, and is a primary reason behind the cyclical nature of the fertilizer industry.
Exponential growth in the global population and strong growth in per capita meat consumption are the primary drivers for strong fertilizer demand. According to World Bank estimates, the global population is expected to grow to nine billion by 2050. In the shorter term, the population is expected to grow by 74 million per annum between 2010 and 2025, and fall by 58 million per annum from 2025-2040.
Increasing demand is exerting significant pricing pressure on fertilizers, but input costs also have a role to play. Natural gas is the primary input in the fertilizer production process, and fertilizer prices are correlated to natural gas prices. Due to the cyclicality in natural gas prices, there is overcapacity and supply shortages in the industry at different times, which affects fertilizer prices.
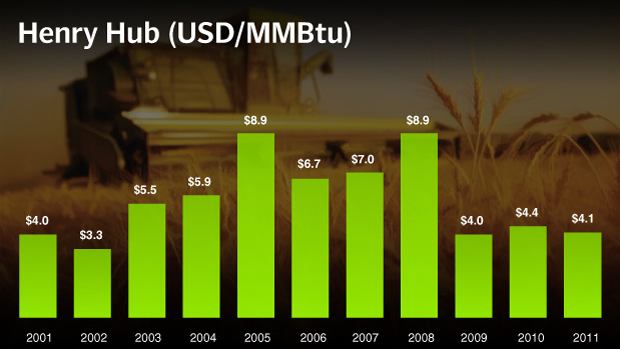
henrry-hub
Nitrogenous Fertilizers
Around 83% of the total ammonia produced globally is used to manufacture nitrogenous fertilizers, of which urea and ammonium sulphates are the most widely used. Urea input prices have risen almost 68% since they bottomed out in 2009.
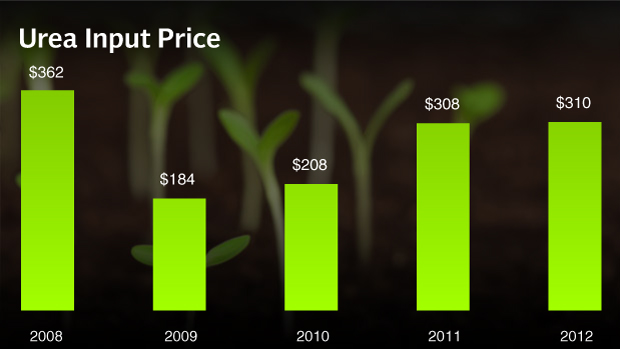
urea-input-price
Phosphatic Fertilizers
Phosphorous, produced from phosphate rock, is the primary input in the manufacturing of phosphatic fertilizers. Di-ammonium Phosphate (DAP) and Monoammonium phosphate (MAP) are the most commonly used phosphatic fertilizers both inside and outside the US.

DAP-input-price
Potash Fertilizers
Potassium nitrate, potassium chloride and potassium sulfate are the three main types of potassium fertilizers. Potassium, the primary input in the manufacturing of potassium fertilizers, is extracted from potash. Potash input prices were resilient in 2009, but dropped 45% in 2010. They have recovered slightly since then.

potash-input-price

CAN-cif-germany
Industry Drivers
Fertilizer demand is expected to increase in the future due to growing population pressures and increasing scarcity of arable land. Both factors are pushing the need to improve agricultural yields, and global demand for grains and oilseeds has grown at a CAGR* of 1.8% and 4.2% respectively over the past 40 years. On the other hand, growth in arable land has lagged far behind with a CAGR of 0.1%. However, higher yields for important grains such as soy (CAGR 1.3%) and corn (CAGR 1.8%) have maintained the balance.

global-consumption-growth

global-corn-yield
Overall demand for fertilizers is expected to grow 1.9% between 2012 and 2016, and the strongest growth is expected in potassium fertilizers.

global-growth-infertilizer-demand
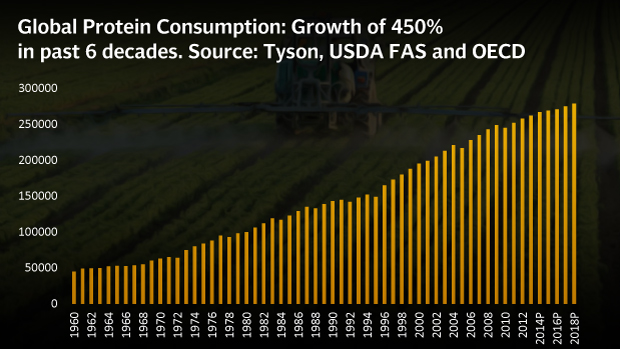
With the expansion of the middle class, worldwide protein consumption has grown at a CAGR of 3% for the past five decades, and has consistently surpassed the population CAGR of 1.6%. The US Department of Agriculture projects that this trend will persist through 2018, primarily because of higher consumption in developing economies.
Protein consumption is heavily dependent on grain crops like corn, rice and wheat. For example, 100 pounds of chicken meat requires 3.7 bushels of corn to produce; pork requires eight bushels; whereas beef requires eleven bushels, according to Tyson Foods, Inc. (TSN).
world-fertilizer-consumption
global-protien-production
As the secular uptrend in fertilizer demand continues, companies involved in the agricultural sector – especially fertilizer and seed companies – will see their revenues soar. The Mosaic Company (MOS), the Potash Corporation of Saskatchewan Inc. (POT), the Monsanto Company (MON) and the E. I. du Pont de Nemours and Company (DD) are expected to benefit the most from the trend.
We will discuss the valuation and performance of agricultural companies in a future article and analyze which ones are buys and which ones are sells.
*Compound annual growth rate
Sources: Bloomberg, Tyson, USDA FAS and OECD