
OVERVIEW
MANAGEMENT
PERFORMANCE
POSSIBILITIES
CAPITALS
ACTIVITIES
ACTORS
BURGESS
|
ECONOMICS
THE PENN WORLD TABLE PWT 8.0 ... Recasting international income differences: The next-generation Penn World Table 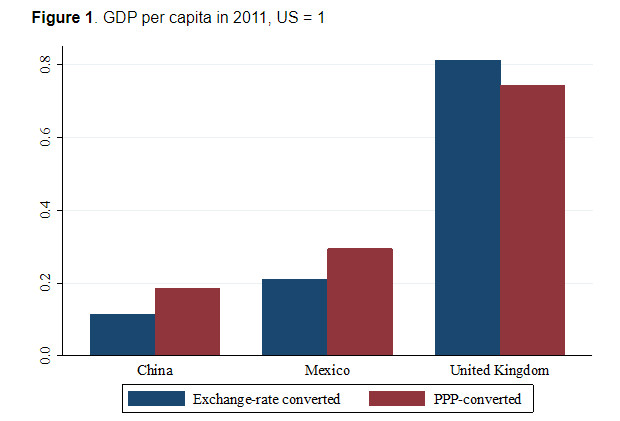
Original article: https://voxeu.org/article/recasting-international-income-differences-next-generation-penn-world-table Burgess COMMENTARY I have had an interest in data and how things work since my childhood, and in many ways I have been disappointed at the way in which data usually reflects some major simplification of reality. I see this as a major reason why such economic data does rather little to change behavior. While I appreciate the efforts that have gone in to compare economic performance between countries, from a 'management' perspective that data have not been very effective. One of the ways to make data much more effective as a management tool is for a small number of data series to be studied together as a group rather than the data being consolidated in some arbitrary way (no matter how sophisticated). The most powerful management data in all of history are the reporting associated with business accounting which reports on money in four distinct ways (1) revenues, (2) expenses, (3) assets, and (4) liabilities. The first two relate to flows of value during a period of time, while the last two relate to the state at a moment in time. Money as a measure served as a 'proxy' for value. I always remind myself that the framing of double entry accounting is very old and it has stood the test of time. But I am always also mindful that it has only been applied in a limited way and mainly for the benefit of rich investors. This was true going back to merchant adventurers in Italy as it was in more recent times during the period of the Victorian industrial revolution. Most of the rules related to modern business reporting and accountability were formulated in this period to limit the blatant lying that business entrepreneurs used to obtain money from investors. In the present century it is high time for accounting to be modernised better to reflect the issues of our time ... and a starting point for this is to incorporate social state and social impacts and environmental state and environmental impacts into the basic accounting framework that is generally used. Essentially, all the pieces needed exist, but they are not yet being used in a sonsistent, coherent, comprehensive way ... and this is what TrueValueMetrics.org is working to accomplish. Peter Burgess | ||
|
Recasting international income differences: The next-generation Penn World Table
Authored by: Robert Feenstra, Robert Inklaar, Marcel Timmer
Why some countries are richer than others is among the most difficult and important questions in economics. Yet, the Penn World Table, widely used to compare living standards across countries, has faced criticism in recent years. This column discusses how the new version of the tables both addresses these criticisms and provides a wider range of tools that will help researchers gain insight into why income differs across countries. The Penn World Table has long been a standard data source for those interested in comparing living standards across countries and explaining differences in cross-country growth. The article describing version 5.6 (Summers and Heston 1991), is among the most widely cited papers in economics with well over 1000 citations. Yet the data has also come under criticism. Studies by Johnson, Larson, Papageorgiou and Subramanian (2009, 2013), Ciccone and Jarociński (2010), and Katayama and Ponomareva (2010) show that new versions of the tables can sometimes radically change rankings of country growth and overturn existing results in the literature. The new Penn World Tables, version 8.0 In version 8.0 of the Penn World Table (available at www.ggdc.net/pwt) we have made changes to address the sensitivity to revisions and to make the tables more useful by adding information on trade, capital, and productivity. This column introduces this new version, drawing on our recent work (Feenstra, Inklaar and Timmer 2013a, b; Inklaar and Timmer 2013). The Penn World Table is primarily a dataset on real GDP, where ‘real’ indicates that GDP levels are made comparable across countries using purchasing power parities to convert to a common currency. Purchasing power parities aim to measure the relative price level of an economy and are systematically different from exchange rates, since they cover not only the price of traded but also of non-traded goods and services. Purchasing power parity-converted GDP per capita of poorer countries tends to be higher than exchange-rate-converted GDP per capita, because prices of non-traded products tend to be lower (the Balassa-Samuelson/Penn effect) (see e.g. Figure 1). Data sources The Penn World Table has always used the results of detailed price surveys from the International Comparison Program (now run from the World Bank) and combined these with National Accounts data on GDP and its components (consumption, investment, trade) to arrive at real GDP for most countries in the world for as far back as 1950. As a result, the quality of the Penn World Table depends on:
Figure 1. GDP per capita in 2011, US = 1 What is new in Penn World Table 8.0? The improvements in version 8.0 come in three parts:
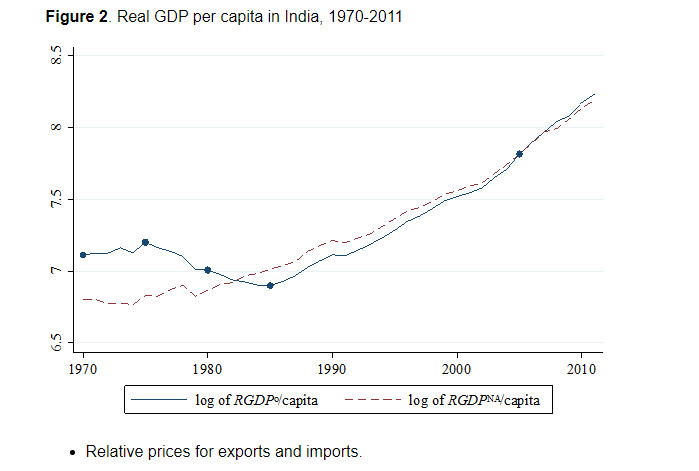
Price surveys by the International Comparisons Project are only infrequently organised. An important reason why Penn World Tables changed from one version to the next was that each version was based on a different purchasing power parity benchmark year: version 5.x on 1985, 6.x on 1996 and 7.x on 2005. Starting from a new purchasing power parity benchmark year, purchasing power parities for earlier and later years were extrapolated assuming that they change in line with relative inflation. So if inflation in India would be 5% higher than in the US over a given period, the purchasing power parity would rise by 5%. However, this has turned out to be a poor estimate of the actual change in purchasing power parities from one benchmark to the next, and as a result a new version of the Penn World Table could report substantially changed real GDP estimates for all years. We changed this for the new dataset. In version 8.0, we use all available purchasing power parity benchmark data under the principle that the best estimate of real GDP in, say, 1980 is based on purchasing power parity data for 1980 rather than on extrapolations from 2005. For years in between benchmarks, we interpolate and only when reaching the first or last benchmark that a country participated in, we extrapolate using inflation data. As a result, new benchmark data will no longer affect real GDP data for earlier benchmark years, addressing an important criticism of Johnson et al. (2013). This difference in how purchasing power parities are computed has substantial consequences for real GDP over time. Figure 2 shows real GDP in India from 1970 (the first benchmark) until 2011, comparing RGDPo, which is based on multiple purchasing power parity benchmarks, and RGDPNA, which combines the 2005 level with National Accounts GDP growth rates. Especially between 1975 and 1985, real GDP per capita changed at a much different rate than implied by GDP growth rates. These results imply, in our view, that real GDP measures should be used not as a substitute for National Accounts growth figures for a country, but instead as measures of relative income or output across countries.
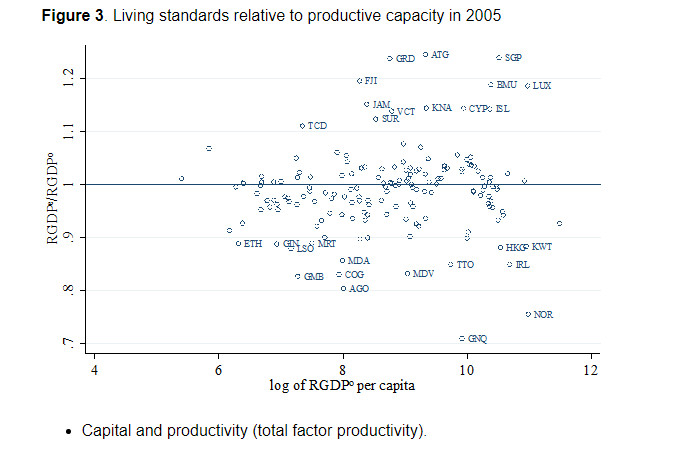
Figure 2. Real GDP per capita in India, 1970-2011 Relative prices for exports and imports. Until now, the purchasing power parity for real GDP in the tables had been solely based on relative prices of consumption and investment, ignoring differences in the relative prices of exports and imports. As shown in Feenstra, Heston, Timmer and Deng (2009), this implies that real GDP was more appropriately a measure of relative living standards rather than of relative productive capacity: real GDP could be high because of favourable terms of trade as well as because of high productive capacity. The data-availability constraint An important bottleneck to improving this has been data availability. Even for traded goods, violations of the law-of-one-price are substantial enough that assuming that the relative price of exports and imports is equal to the exchange rate is overly simplistic. Yet export and import prices are not part of the International Comparison Program survey framework, so better measures have to be based on unit values computed from trade quantities and values and these potentially suffer from quality biases. Recent work of Feenstra and Romalis (2012) has shown how trade unit values can be adjusted for differences in the quality of products, and their adjusted prices are used in version 8.0 to estimate real GDPo, a measure of relative productive capacity. The Penn World Table 8.0 also still includes a measure comparable to the old real GDP concept, which we refer to as GDPe, a measure of relative living standards. As shown in Figure 3, the difference between these two measures can be considerable, especially for small open economies such as Singapore (SGP) and Hong Kong (HKG).
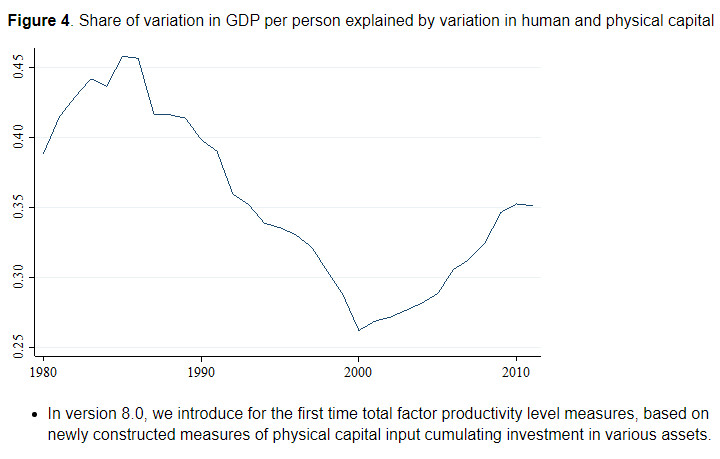
Figure 3. Living standards relative to productive capacity in 2005 Capital and productivity (total factor productivity). Measuring income differences is useful, but understanding the driving forces of income differences is the ultimate aim. One step in this direction is provided by development accounting (e.g. Caselli 2005). This is a method akin to growth accounting and determines to what extent differences in endowments of human and physical capital can account for differences in income levels. The residual is typically referred to as differences in total factor productivity.
Figure 4. Share of variation in GDP per person explained by variation in human and physical capital In version 8.0, we introduce for the first time total factor productivity level measures, based on newly constructed measures of physical capital input cumulating investment in various assets. We also introduce human capital based on years of schooling of the population and new measures of the share of labour income in GDP. These provide a clearly different view than some of the older approaches, as in Caselli (2005), plus they allow us to compare development accounting results over time. Figure 4 shows that observed inputs explained much more of cross-country income differences in the 1980s than in more recent years, though there has also been a notable increase in explained variation since 2000. More broadly, the ready availability of capital and productivity will help to explain such patterns (Inklaar and Timmer 2013) but also be useful in other settings. For instance, in an analysis on why capital flows from poor to rich countries, Gros (2013) estimates his own capital stocks. Conclusions Accurate insight into the size and causes of income differences around the world requires data that is well-suited to the task. The Penn World Table 8.0 has addressed some of the main criticisms raised against it in the past, making it more robust to new price data and we have greatly expanded the scope of information that is available. With the release of the new Penn World Table and supporting documentation (available at www.ggdc.net/pwt), we hope to have laid the groundwork for new and better insights into why some countries are so much richer than others. References
Why does capital flow from poor to rich countries? Daniel Gros Is newer better? The Penn World Table growth estimates Simon Johnson, Arvind Subramanian, Will Larson, Chris Papageorgiou
| The text being discussed is available at | https://voxeu.org/article/recasting-international-income-differences-next-generation-penn-world-table and |