Original article:
https://www.visualcapitalist.com/chinas-economy-40-years-of-soaring-exports/
China’s Economy: 40 Years of Soaring Exports
Published on June 16, 2021
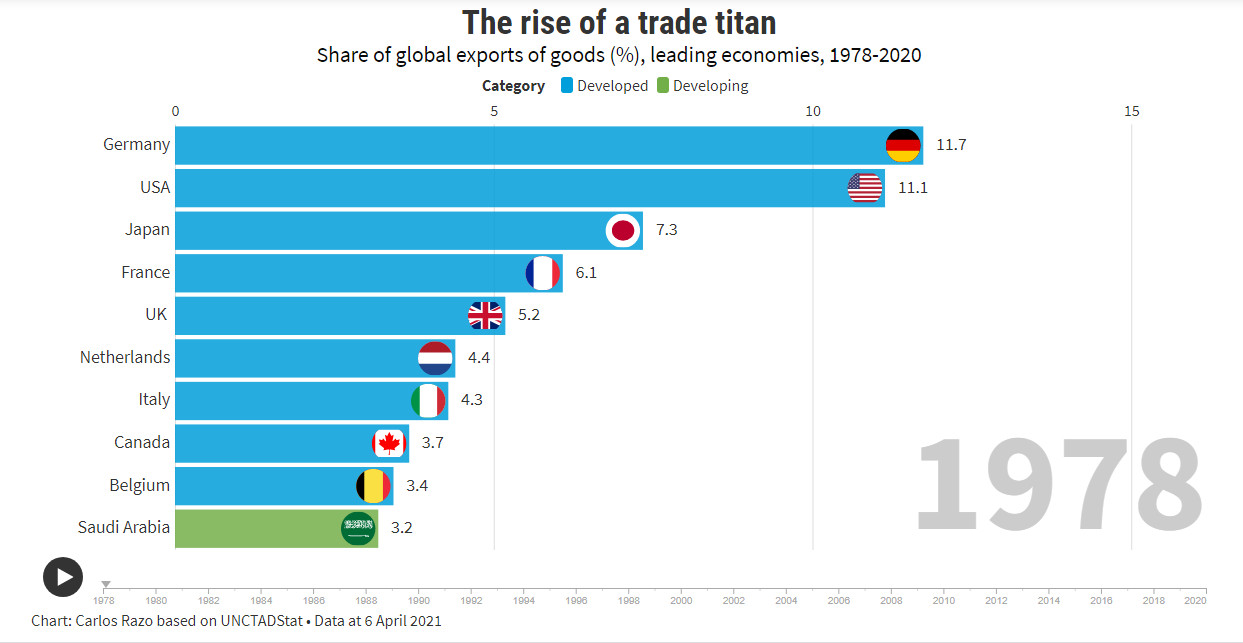
The rise of a trade titan
Share of global exports of goods (%), leading economies, 1978-2020
Animated Chart: 40 Years of Soaring Exports in China
 2020
Germany
7.8
USA
8.1
Japan
3.6
France
2.8
Netherlands
3.8
China
14.7
Korea, Rep.
2.9
Hong Kong (China)
3.1
Italy
2.8
Belgium
2.4
2001: China joins the World Trade Organization
Chart: Carlos Razo based on UNCTADStat • Data at 6 April 2021
China has the second highest GDP in the world, and it exports 15% of all the world’s goods. But how did this come to be?
A mere 40 years ago, China’s economy was in an entirely different situation, making up less than 1% of global exports and still in the infancy stages of building its economy. The above animated chart from the UNCTAD showcases China’s rise to global trade dominance over time.
Timeline: The Rise to Power
The China of the mid-20th century looks remarkably different when compared to the modern-day nation. Prior to the 1980s, China was going through a period of social upheaval, poverty, and dictatorship under Mao Zedong.
The 1970s
Beginning in the late 1970s, China’s share of global exports stood at less than 1%. The country had few trade hubs and little industry. In 1979, for example, Shenzhen was a city of just around 30,000 inhabitants.
In fact, China (excluding Taiwan* and Hong Kong) did not even show up in the top 10 global exporters until 1997 when it hit a 3.3% share of global exports.
Year Share of Global Exports Rank
2020
Germany
7.8
USA
8.1
Japan
3.6
France
2.8
Netherlands
3.8
China
14.7
Korea, Rep.
2.9
Hong Kong (China)
3.1
Italy
2.8
Belgium
2.4
2001: China joins the World Trade Organization
Chart: Carlos Razo based on UNCTADStat • Data at 6 April 2021
China has the second highest GDP in the world, and it exports 15% of all the world’s goods. But how did this come to be?
A mere 40 years ago, China’s economy was in an entirely different situation, making up less than 1% of global exports and still in the infancy stages of building its economy. The above animated chart from the UNCTAD showcases China’s rise to global trade dominance over time.
Timeline: The Rise to Power
The China of the mid-20th century looks remarkably different when compared to the modern-day nation. Prior to the 1980s, China was going through a period of social upheaval, poverty, and dictatorship under Mao Zedong.
The 1970s
Beginning in the late 1970s, China’s share of global exports stood at less than 1%. The country had few trade hubs and little industry. In 1979, for example, Shenzhen was a city of just around 30,000 inhabitants.
In fact, China (excluding Taiwan* and Hong Kong) did not even show up in the top 10 global exporters until 1997 when it hit a 3.3% share of global exports.
Year Share of Global Exports Rank
- 2000 4.0% #7
- 2005 7.3% #3
- 2010 10.3% #1
- 2015 13.7% #1
- 2020 14.7% #1
*Editor’s note: The above data comes from the UN, which lists Taiwan as a separate region of China for political reasons.
The 1980s
In the 1980s, several cities and regions, like the Pearl River Delta, were designated as Special Economic Zones. These SEZs had tax incentives that worked to attract foreign investment.
Additionally, in 1989, the Coastal Development Strategy was implemented to use strategic regions along the country’s coast as catalysts for economic development.
The 1990s and Onwards
By the 1990s, the world saw the rise of global value chains and transnational production lines, with China offering a cheap manufacturing hub due to low labor costs.
Rounding out the ‘90s, the Western Development Strategy was implemented in 1999, dubbed the “Open Up the West” program. This program worked to build up infrastructure and education to retain talent in China’s economy, with the goal of attracting further foreign investment.
Finally, China officially joined the World Trade Organization in 2001 which allowed the country to progress full steam ahead.
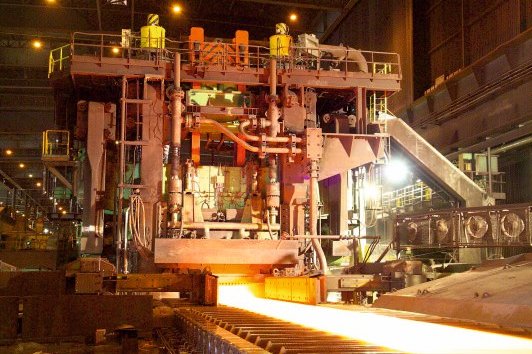
Made in China
Today China is a trade giant and manufacturing behemoth. Only the U.S. and Germany come close to its share of global exports, sitting at 8.1% and 7.8% respectively.
Rank Country Share of Global Exports (2020)
- #1 🇨🇳 China 14.7%
- #2 🇺🇸 U.S. 8.1%
- #3 🇩🇪 Germany 7.8%
- #4 🇳🇱 Netherlands 3.8%
- #5 🇯🇵 Japan 3.6%
- #6 🇭🇰 Hong Kong SAR 3.1%
- #7 🇰🇷 South Korea 2.9%
- #8 🇮🇹 Italy 2.8%
- #9 🇫🇷 France 2.8%
- #10 🇧🇪 Belgium 2.4%
China’s manufacturing industry has become dominant in producing just about anything from commonplace household items to integral pieces in automotive manufacturing. Some staples of Chinese manufacturing are:
Precision instruments
Semiconductors
Industrial machinery for computers and smartphones
COVID-19 made China’s integral role in the global economy even more visceral, as major delays in the supply chain occurred when the virus hit the country.
An Economic Superpower
In 2021, China’s trade recovery from the crisis has bested most other countries—in Q1 2021, its exports grew by almost 50% compared to the previous year’s quarter, to around $710 billion.
And the country is not slowing down any time soon. Further plans for economic development are well under way, like Made in China 2025, with the goal of becoming a dominant player in global high-tech manufacturing. Additionally, the famous One Belt, One Road initiative has been funding infrastructure projects globally over the past decade, and the country is also a founding member of the RCEP—which is soon to be the world’s biggest trading bloc.
However, China still faces a series of challenges, such as:
Population decline
The onset of labor saving technology
Trade wars with U.S. and sanctions from other trade partners, like Europe
The emergence of ASEAN trade powers, like Vietnam
A declining population has many implications like a shrinking workforce and domestic market. Additionally, many companies are setting up shop in less costly manufacturing hubs like Vietnam.
Furthermore, inexpensive innovations in labor-saving technologies, such as robotics and automation, have already begun to undermine the cheap manual labor that has made China the world’s manufacturer.
All of these elements and more could potentially spell a slowing of growth in China’s export dominance. However, while the future for China may not be certain, currently, global trade and production could not function without it.
| The text being discussed is available at
https://www.visualcapitalist.com/chinas-economy-40-years-of-soaring-exports/
and
| |
