OVERVIEW
MANAGEMENT
PERFORMANCE
POSSIBILITIES
CAPITALS
ACTIVITIES
ACTORS
BURGESS
Energy Market | ||||||||||||||||||||||||||||||||||||||||||||||||||||||||||||||||||||||||||||||
|
Burgess COMMENTARY | ||||||||||||||||||||||||||||||||||||||||||||||||||||||||||||||||||||||||||||||
|
OPEC A Year Later: Is there a war for market share and who is winning? November 30, 2015 Joe Solari OPEC, Spotlight 1
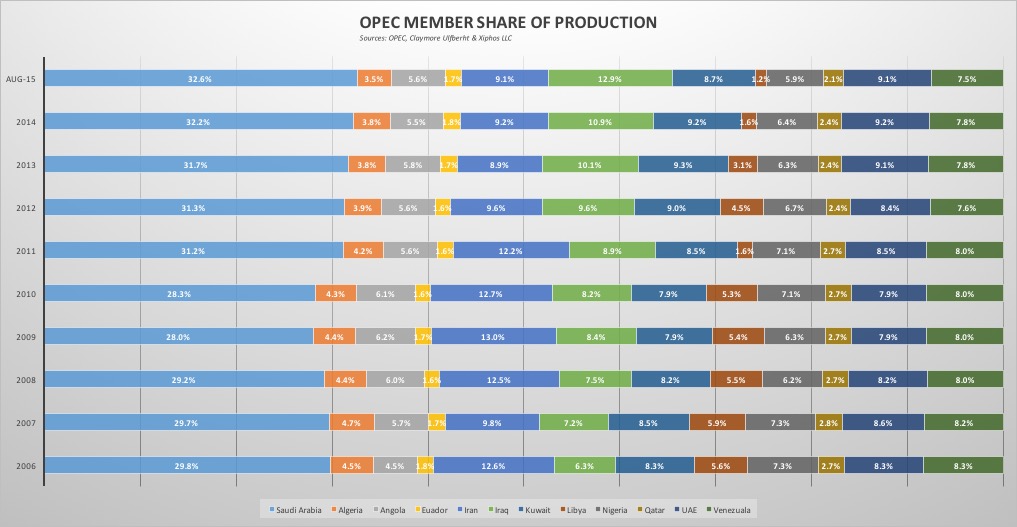
http://cuxllc.com/?p=81 As we close out 2015 and approach the 168th ordinary meeting of OPEC on December 4th it will be a year ago that OPEC notified the World that the cartel would not curb production and would rather let market forces determine price and market share. This along with a historic inventory increases in the United States and rumblings of a China slow down tanked oil prices and put energy markets into a historic down cycle. In honor of the anniversary and in anticipation of this years last regular OPEC meeting we are running a series of articles around the topic of OPEC, it’s portion of world oil supply and the part that OPEC imports play in US Oil Demand. It is our intention to bring some insight to our readers as to the forces at play on Member Nations of OPEC and the Markets they serve. Throughout this week we will be releasing the material in several parts with the last part to only those who sign up for our free news letter. Part 1: Inside OPEC OPEC Internal Market Share Changes We begin with a look within OPEC to see if there has been some of the infamous cheating that we hear about and who might be causing internal strife. OPEC is generally looking to produce about 35 million Bbls a day of Crude Oil through quotas agreed upon with member nations. There has been a 962,000 Bbl/day increase in overall OPEC production and while production has increased overall there has been some significant changes within OPEC’s internal market mix as shown in the chart and table below. Chart 1: OPEC Member Share of OPEC Production
UI112015OPEC2 Table 1: OPEC Share Change 2006-August of 2015
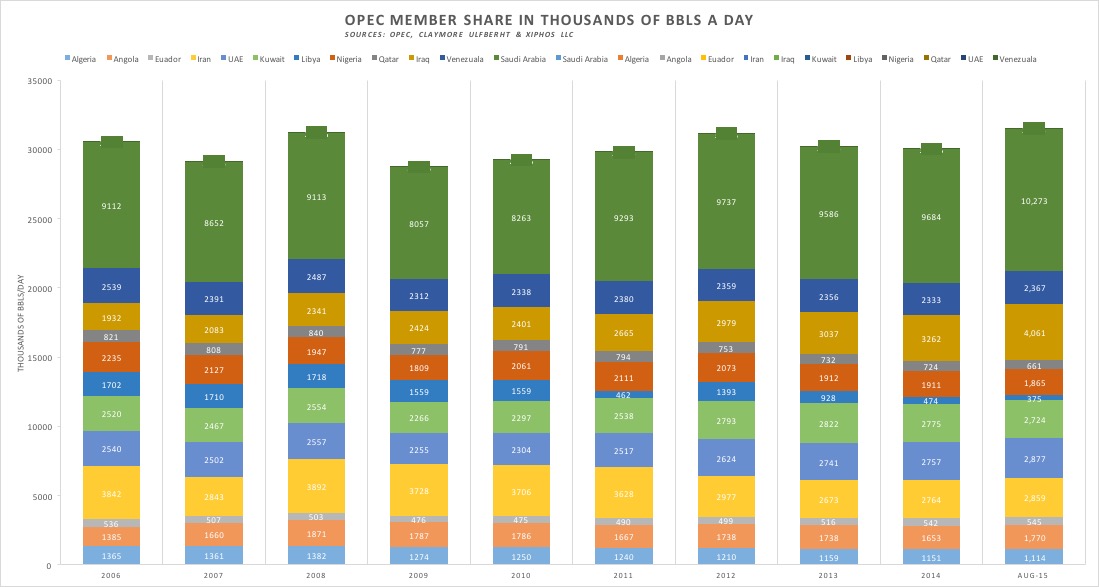
Chart 2: OPEC Production in Barrels 2006 through August 2015
This leaves us wondering how Members feel about these shifts in share. While Iran’s reductions are associated with the sanctions and Libya’s with it’s internal conflict it appears that Iraq and Saudi Arabia have gone above and beyond to fill the gaps created by Member shortfalls. With sanctions being lifted Iran will look to bring another 500,000 to a million barrels of production to market. If Iran and Iraq continuing to increase production to past levels this will more than offset any declines expected in the US tight oil space in 2016. In analyzing the OPEC statement that the the organization would let market forces work and focus on holding market share the appears to be some initial indication that market share is improving for them. Chart 3 shows monthly OPEC market share against monthly WTI price. Although well off the nearly 42% share of world demand seen before the 2008 financial crisis market share has come off the 2014 lows of 38.4% to get above 39%. Time will tell if these increases are an anomaly or a trend. Chart 3: Opec Share of World Supply and WTI
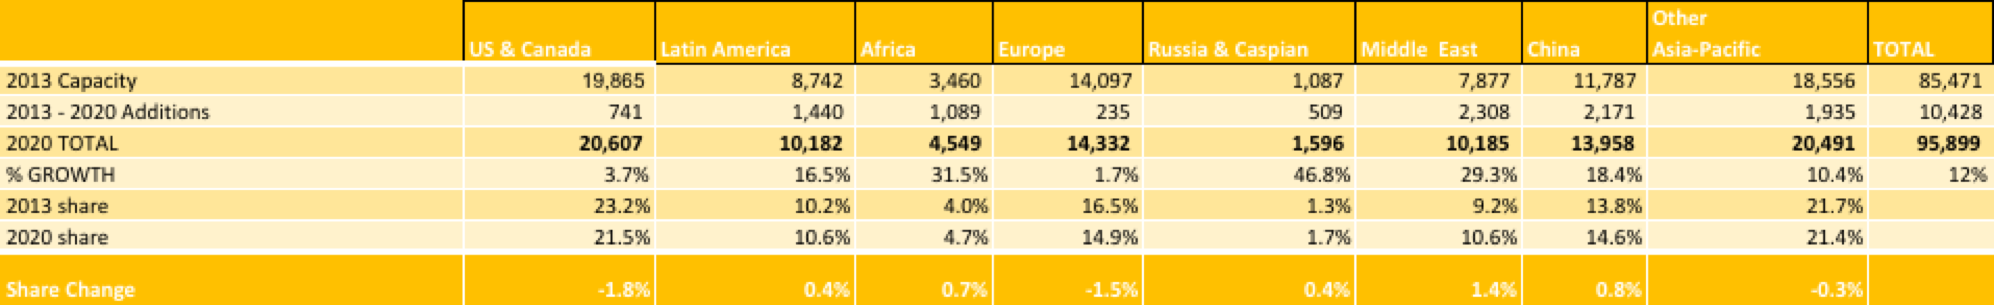
In Part two we will explore further OPEC’s US market share and how that has been impacted by the Tight Oil Boom. http://cuxllc.com/?p=90 This article continues from part 1 Part 1 A final point looking at the world demand for oil. World oil demand is pretty predictable. as we have shown in Who is Driving? Supply or Demand and large corporations that refine crude into usable products spend billions to make sure capacity is moving along with world demand tied to population and GDP. Furthermore the refineries are built to run on specific crude slates so there is little flexibility in the types of crude they can run. This topic is reviewed again to make the point that if there is a misconception that demand will jump up and use up surplus oil that just won’t happen. Below is a chart from OPEC Data that outlines current refinery capacity and planned increases to refining capacity. There does not seem to be any spectacular growth bursts that we can look to for salvation in the near term. In fact projections from OPEC and EIA as well as other forecast around a 26% increase in refinery capacity by the end of 2040 with market share making moving from the US and Europe to Asia. giving China and Asia the attention of oil exporters.
As we move to talk about OPEC and the US a point to keep in mind when thinking about the oil export ban. First Refiners can export refined product doing this provide a bigger value capture to the US economy that exporting crude and eliminates the issue that comes with crude and that is that to be a long term supplier to an importer they need to have the ability to slate that crude at the refinery and they will be evaluating if the reserves demonstrate a reliable supply. This is where OPEC and specifically Iran, Iraq and Saudi Arabia have a superior offering than the rest of the world and why Saudi and Iraq continue to be a major supplier to the United States. OPEC supply to the USA It is not news that the US is importing less oil. Tight oil has reversed the decline of domestic production and from 2007 accelerated at rates that caught OPEC off guard. The reduction from 49% of all US crude being imported in 2006 to 37% in 2015 has has created a big issue given the USA has the largest refining capacity in the world.
UI122015OPEC4 Along with the decline in imports OPEC is also facing it’s share of competition for imported barrels. Just like in Asia others also look to participate in the US import market, most notably being Canada.
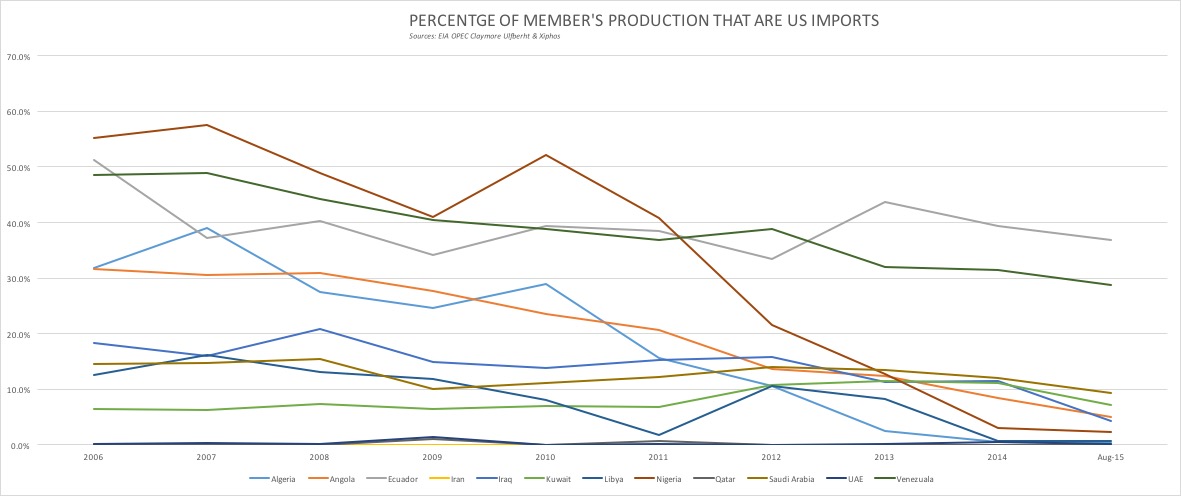
OPECMEMBERSHARE Overall imports are shrinking because of Tight Oil Production and since this is a recent phenomena and most of US Refining was reworked in the past 20 years for heavier crude slates, the domestic production is squeezing out lighter and medium oil, seen in who is getting excluded over time from US imports. This next chart and table show the winners and losers within OPEC’s members that import to the US. It shows the percentage of total production by each member county since 2006 that was going to US imports. Maybe winners is not appropriate as every country has seen some decline is US sales.
opectotalprod as import
Sharechart So with the 2015 regular meeting wrapped up and no production changes by OPEC we are left in a similar place as a year ago, non opec producers continue to produce and for political or financial reasons will not curb production. The press continues to identify Shale as the new swing producer, but it is my opinion that there is confusion on what that means. Saudi was able to be the swing producer because they had excess capacity to deliver crude to market, large proven reserves and a clear command and control structure, When another source of oil was taken off the market like Libya they could quickly respond with additional additions or contractions to support price. Shale has the ability to bring oil to the market quickly but can not deliver that oil to the whole market nor does it have a clear command and control structure. Tight oil will dance for only one master and that is the Market. Economists will tout that the Market is the most efficient process to reach equilibrium but what they fail to ever be able to predict as how painful or timely the market will be, and while many call for market forces to prevail they forget that crude oil has been a managed market through, monopolies government quotas or cartels for most of its history. We may be experiencing for the first time a truly market driven oil market and while this will be good for consumers and for delivering energy equality it could have severe repercussions for the US tight oil space, the financial markets that have 300 billion dollars exposed and the petro-states that built a foundation on $100 oil. The current situation also has been created by the US not having a coherent energy policy. Specifically regarding Oil and Gas if energy independence is a real goal then there needs to be a plan as to the development and conservation of the hydrocarbons we have. However the reality is that we don’t have those kinds of reserves nor do we know what or when other alternative energy will take hold we really need to focus on energy security and that means being able to source and use fossil fuels from multiple sources while also finding new ways to power our economy. The market won’t help us do that the market will only get you to price that clears the market. This also leads to questions as to how the US should participate on global markets. Do we remain a powerful indirect player in global markets or do we provide domestic exploration with unfettered access to the global market? Do we push an agenda to become a long term competitive supplier of refined products and petrochemicals. For OPEC many in the press are calling this the last innings for the cartel. While the ability to manage the market by quotas and swing production may have passed, the organization represents over 40% of the known reserves and biggest exporter of crude and therefore will be a long term player. What will happen is a long painful process that will re-assert Saudi Arabia as the dominant oil exporter in the world. In this process customers, market share and capacity to produce will shift between members and because the market is the tool being used by the Arab Kingdom there should be long lasting effects that eliminate Investment in oil projects or shale plays that are not economic and bring stability to global markets. As a final note, I believe that global markets will resolve before Tight Oil will. The main oversupply is to the US and Refinery design will continue to limit what can be used so Inventories will take longer to use. While much is made of the 80-90% decline curves of tight oil. Productivity and cost cutting are offsetting the decline and keeping up production and producers able to service debt and continue to keep attracting investment. | ||||||||||||||||||||||||||||||||||||||||||||||||||||||||||||||||||||||||||||||
|
Joe Solari OPEC, Spotlight 1 and 2
November 30, 2015 | ||||||||||||||||||||||||||||||||||||||||||||||||||||||||||||||||||||||||||||||
| The text being discussed is available at http://cuxllc.com/?p=81 and http://cuxllc.com/?p=90 |