OVERVIEW
MANAGEMENT
PERFORMANCE
POSSIBILITIES
CAPITALS
ACTIVITIES
ACTORS
BURGESS
Carbon |
|
Burgess COMMENTARY |
|
On a Plane? Enjoy the View of the Planet You're Killing! ... Airplanes have a huge carbon footprint, and Obama is about to crack down.
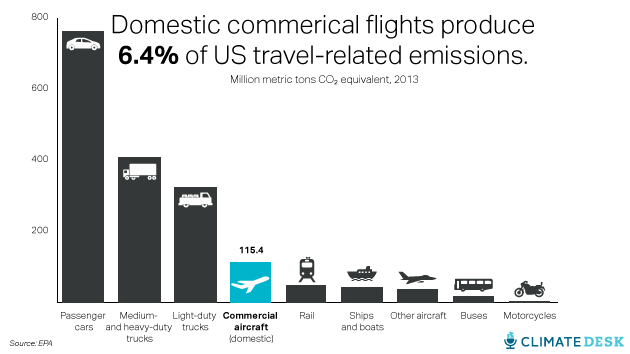
The Environmental Protection Agency is expected to declare soon that greenhouse gas emissions from airplanes are a danger to human health because they contribute significantly to climate change. Right now, air travel is the largest unregulated source of carbon pollution in the United States. But once the EPA releases its endangerment finding, the agency will be required under the Clean Air Act to issue new rules to restrict those emissions. President Barack Obama has already used his executive authority to tackle emissions from vehicles and power plants, so airplanes seem like a logical next step. Just how bad is flying for the climate? Per mile, per passenger, it's by far the most greenhouse-gas-intensive mode of transportation. But because Americans drive so much more often than they fly, it's still a relatively small slice of the overall pie. Here's how it breaks down. Overall, domestic aviation is the eighth-largest source of greenhouse gas emissions nationwide:
Commercial airplanes (not counting military and private planes) are the fourth-largest source of travel-related greenhouse gas emissions:
According to an analysis by University of California-Berkeley researcher Chris Jones, air travel makes up a little more than 3 percent of the average American household's greenhouse gas footprint, assuming a household total of roughly one medium-length and four short round-trip flights per year. You can explore his awesome carbon footprint calculator here to find out how your personal carbon footprint compares. If you're like our friend Eric Holthaus (who now writes for Climate Desk partner Slate), planes could be a much bigger slice of the pie. (After Holthaus realized how much of an impact his flying habit was having, he vowed to give up air travel altogether.)
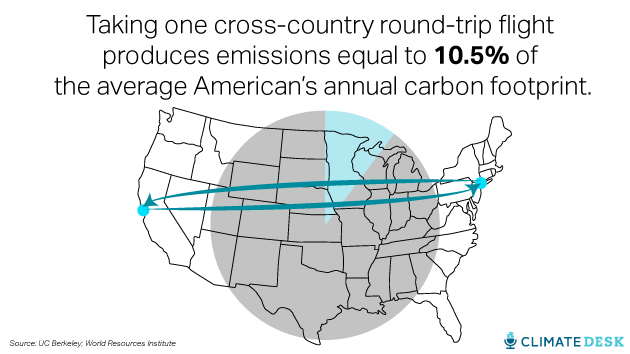
Calculating the carbon footprint of any particular flight is bit challenging compared to ground transportation. With cars, buses, and trains, carbon dioxide accounts for the vast majority of the greenhouse gas emitted. But because planes also leave behind a ton of water vapor (itself a potent greenhouse gas) high in the atmosphere, carbon dioxide 'is only half the story with air travel,' Jones explained. So the total greenhouse gas footprint of a single long flight, say from New York to San Francisco, is actually pretty huge, equal to more than 10 percent of the average American's annual carbon footprint.
So how does all this add up if you're trying to decide how to commute? Here's the breakdown for a trip I often take, from Washington, DC, to New York. Between the four main transit options (bus, car, train, plane), the bus clearly wins out in terms of the smallest footprint per mile, per passenger, according to data from the EPA and Jones. If you're traveling alone, Amtrak is the next best option; if you have a second person in your car, it's about the same for each of you as taking the train. By yourself, the car pollutes about twice as much as the train. Again, the plane is by far the worst. Jones has found that air travel is more competitive, carbon-wise, over longer distances. That's because emissions peak during take-off and landing, so on short flights you get fewer miles per ton of emissions.
Finally, if you just have to fly, here are the major US domestic carriers ranked by fuel efficiency, according to a 2013 report from the International Council on Clean Transportation. On this chart, 1.0 represents the industry-wide average; each airline's number represents their deviation from that average.
Tim McDonnell/Climate Desk Icons, from Noun Project unless noted otherwise: Factory: Ricardo Moreira; House: Maurizio Pedrazzoli; heavy truck: Yorlmar Campos; light truck: Simon Child; boat: Gabriele Malaspina; fighter jet: Juan Garces; motorcycle: Olivier Guin; outlet: Juan Pablo Bravo; office: Alex Tai; shopping: Juan Pablo Bravo; food: Matt Brooks; US map: AlexanderZam/Shutterstock. TIM MCDONNELLClimate Desk Associate Producer Tim McDonnell is Climate Desk's associate producer. For more of his stories, click here. Follow him on Twitter or send him an email at tmcdonnell [at] motherjones [dot] com. RSS | TWITTER |
|
By Tim McDonnell
Fri Jun. 5, 2015 6:05 AM EDT |
| The text being discussed is available at http://www.motherjones.com/environment/2015/06/aviation-charts and |