OVERVIEW
MANAGEMENT
PERFORMANCE
POSSIBILITIES
CAPITALS
ACTIVITIES
ACTORS
BURGESS
US Economy ... Quality of Life |
|
Commentary
The trend of thriving, struggling and suffering in the US population is quite disturbing. The fact that
there are about the same proportion in the thriving and struggling segments in a society where the per
capita GDP is nearer $50,000 oer capita than $40,000 suggests there is something very wrong somewhere.
The TrueValueMetric conclusion is that the GDP metric is almost total nonsense, ignoring all of the
important factors that effect quality of life.
|
|
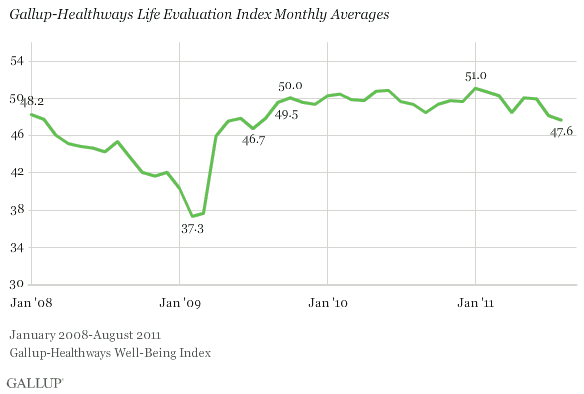
WASHINGTON, D.C. -- Americans' life ratings worsened for the third month in a row in August, with the nation's collective Life Evaluation Index score dropping to 47.6 -- its lowest level since July 2009. This is down from 48.1 in July and the high of 51 in January. IMAGE Life Evaluation Index monthly averages.gif
Gallup and Healthways started tracking Americans' life ratings daily in January 2008, at which time the Life Evaluation Index score for the nation was 48.2. The score plummeted during the fall of 2008 as the economic crisis unfolded and eventually fell to a low of 37.3 in February 2009. Americans began to rate their lives better in April 2009, with the index score reaching a 2009 high of 50 in October that year. Since that time, Americans' life evaluation ratings generally remained in the high 40s to low 50s range. The Life Evaluation Index, part of the Gallup-Healthways Well-Being Index, classifies Americans as 'thriving,' 'struggling,' or 'suffering' according to how they rate their current and future lives on a ladder scale based on the Cantril Self-Anchoring Striving Scale. The overall Life Evaluation Index score is calculated by subtracting the percentage of suffering Americans from the percentage of thriving Americans. The percentage of Americans who rate their lives well enough to be classified as thriving fell to 51.5% in August, from 51.7% in July, and 53.3% in June. As is typically the case, relatively few Americans are 'suffering' -- defined as those who rate their current and future lives between 0 and 4 -- but the 4% falling into that category in August is higher than in any month since March 2009. The percentage of Americans thriving reached a high of 54.2% in February, but has been declining since. IMAGE Percentage Americans thriving, struggling, and suffering.gif
A higher percentage of Americans were thriving than struggling when Gallup and Healthways started tracking these metrics in January 2008. But, when Americans' life ratings collapsed in the fall of 2008, the percentages who were struggling eclipsed those who were thriving. When Americans' life ratings improved in April 2009, the percentage thriving again began to surpass the percentage struggling. Bottom Line Americans' current and future outlook on their lives continued to worsen in August, coinciding with declining economic confidence, which followed the deal to increase the U.S. debt ceiling, Standard and Poor's downgrade of the U.S.' credit rating, and ensuing stock market volatility. Americans' concerns about losing their jobs also climbed in August to record-high levels not seen since 2009. The good news is Americans still feel more positive and optimistic about their lives than they did during the onset and immediate aftermath of the 2008 financial crisis. Still, the return to mid-2009's subdued levels suggests the nation's economic and emotional recovery is undergoing significant setbacks. Editor's Note: Gallup re-estimated its Gallup-Healthways Well-Being Index and Life Evaluation Index data from January 2008 to April 2009 to address context effects that Gallup discovered after the data were originally published. Learn more about what Gallup discovered. About the Gallup-Healthways Well-Being Index The Gallup-Healthways Well-Being Index tracks U.S. and U.K. wellbeing and provides best-in-class solutions for a healthier world. To learn more, please visit well-beingindex.com. To view and export trend data and for more information on each of the six Gallup-Healthways Well-Being Index sub-indexes, please see the following charts: Well-Being Index, Life Evaluation Index, Emotional Health Index, Physical Health Index, Healthy Behavior Index, Work Environment Index, and Basic Access Index. Survey Methods Results are based on telephone interviews conducted as part of the Gallup-Healthways Well-Being Index survey Aug. 1-31, 2011, with a random sample of 30,444 adults, aged 18 and older, living in all 50 U.S. states and the District of Columbia, selected using random-digit-dial sampling. Life Evaluation Index figures from January 2008-April 2009 reflect re-estimates calculated to address context effects that Gallup discovered after the data were originally published. For results based on the total sample of national adults, one can say with 95% confidence that the maximum margin of sampling error is ±1 percentage point. Interviews are conducted with respondents on landline telephones and cellular phones, with interviews conducted in Spanish for respondents who are primarily Spanish-speaking. Each sample includes a minimum quota of 400 cell phone respondents and 600 landline respondents per 1,000 national adults, with additional minimum quotas among landline respondents by region. Landline telephone numbers are chosen at random among listed telephone numbers. Cell phone numbers are selected using random-digit-dial methods. Landline respondents are chosen at random within each household on the basis of which member had the most recent birthday. Samples are weighted by gender, age, race, Hispanic ethnicity, education, region, adults in the household, and phone status (cell phone only/landline only/both, cell phone mostly, and having an unlisted landline number). Demographic weighting targets are based on the March 2010 Current Population Survey figures for the aged 18 and older non-institutionalized population living in U.S. telephone households. All reported margins of sampling error include the computed design effects for weighting and sample design. In addition to sampling error, question wording and practical difficulties in conducting surveys can introduce error or bias into the findings of public opinion polls. For more details on Gallup's polling methodology, visit www.gallup.com.
|
|
by Elizabeth Mendes
September 8, 2011 |
| The text being discussed is available at http://www.gallup.com/poll/148898/Americans-Life-Ratings-Two-Year-Low.aspx |