EXISTENTIAL RISK
CLIMATE CHANGE
CLIMATE CHANGE is one of the biggest risks
that has emerged perhaps in all of history
|

Dangerous heat
|
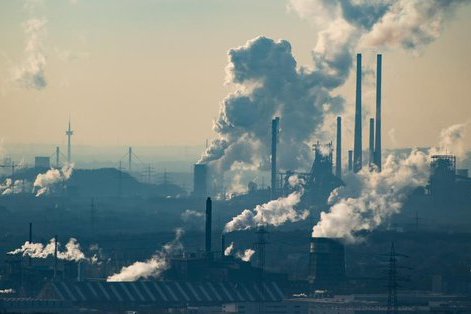
GHG pollution
|
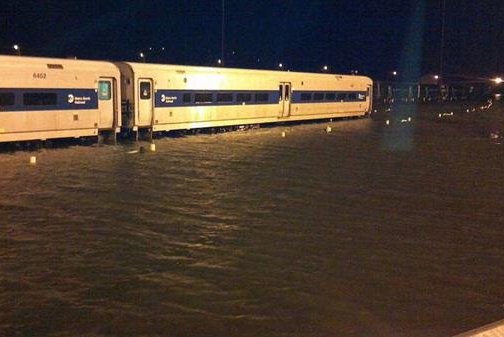
NYC flooded
|
|
This is already happening ... a tipping point has almost certainly been passed
|

|
|
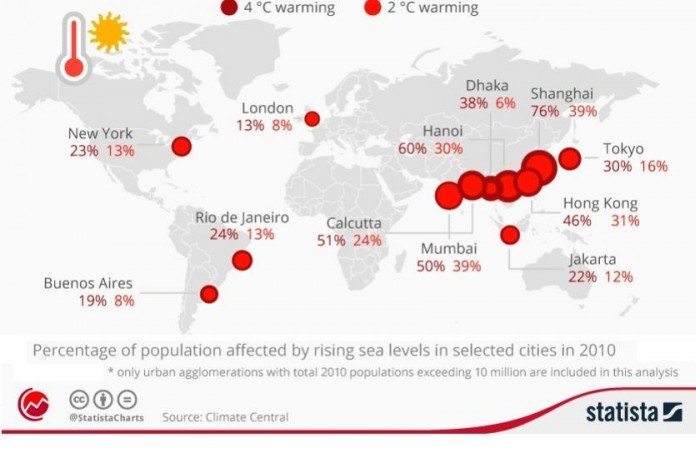
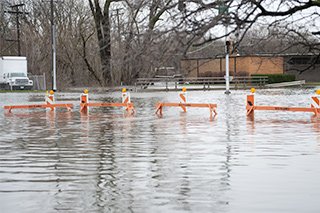
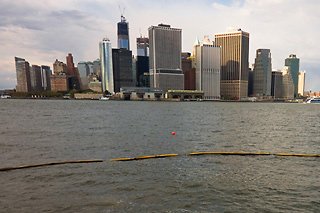
A large part of the world's population live in cities that are becoming affected more and more by sea level rise and related flooding.
This map highlights cities around the world that have large populations likely to be affected by sea level rise. To give this context, the area around New York has been identified, but the coastal areas of the US Gulf Coast and the coastal areas of Florida are not identified.
Extreme weather events are becoming much more frequent. Hurricane force winds cause damage to property and injure and kill people. These winds also produce storm surges that together with ocean rise cause flooding. Unusually large amounts of rainfall also cause flooding. All of this causes massive economic loss and terrible social disruption.
|
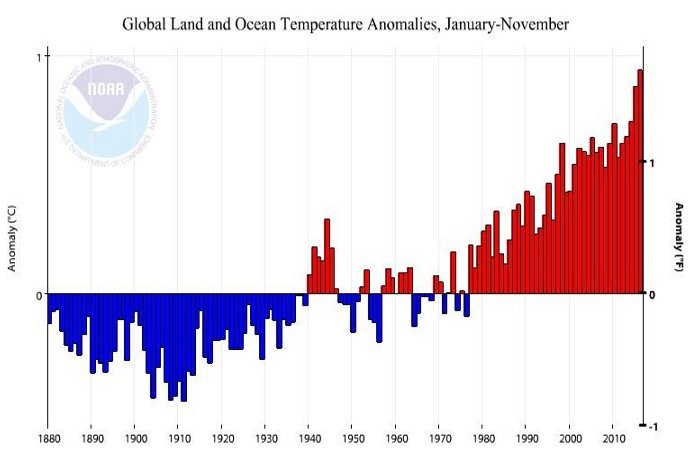
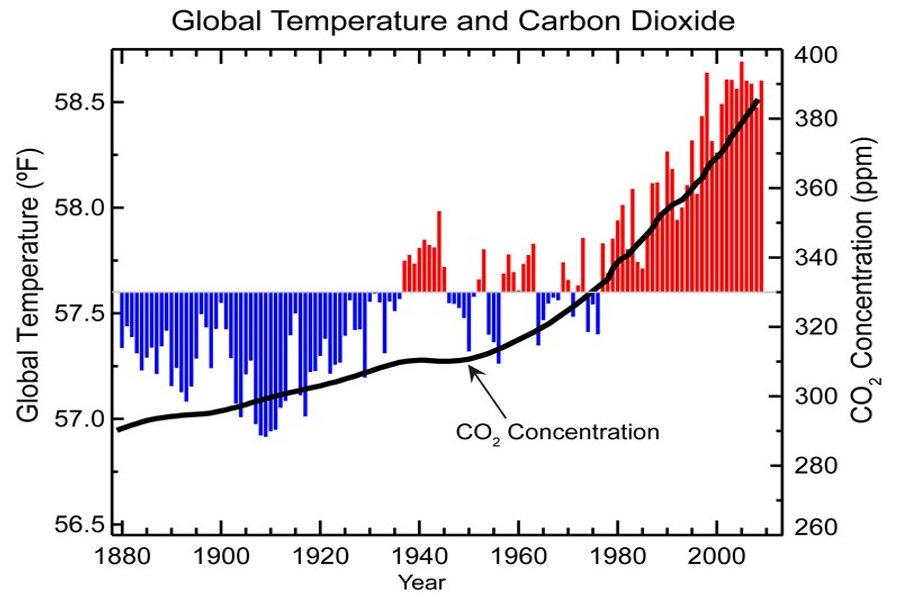
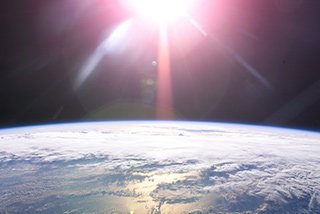
FACT: Land and sea temperatures are rising
and the probable cause is CO2 and other GHGs in the atmosphere
|
|
|
|
FACT 1: Land and sea temperatures are rising as shown by this plot from 1880 to 2015
|
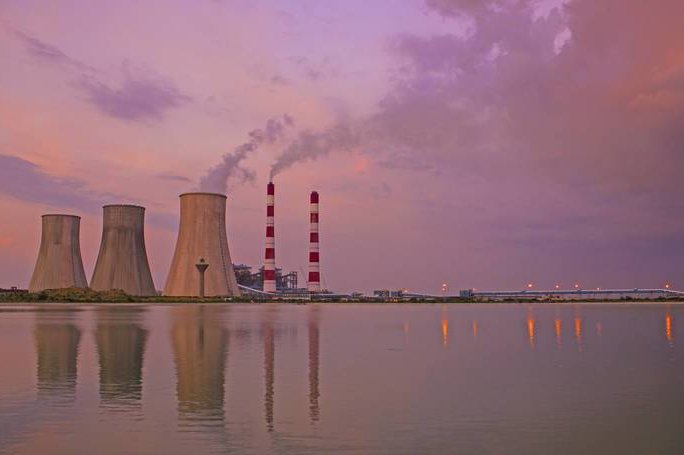
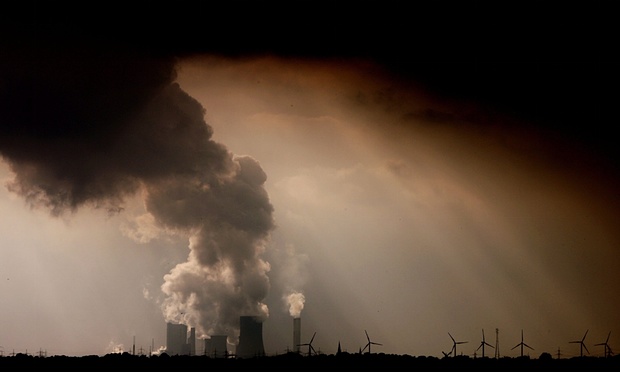
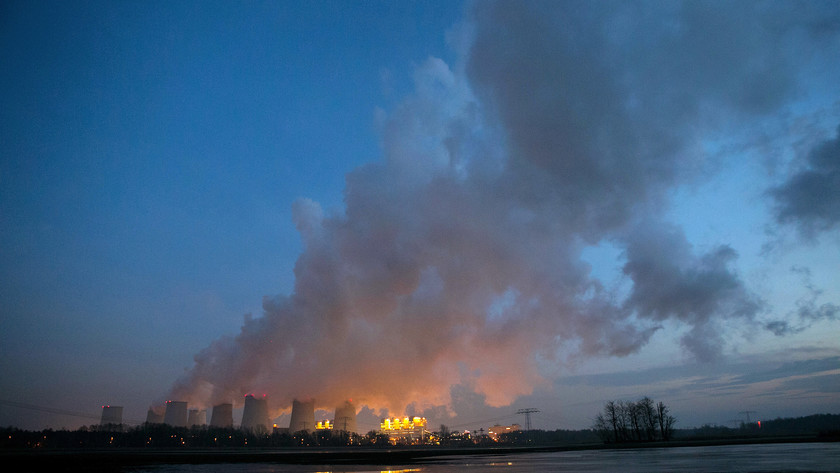
FACT 2: increase in CO2 concentration in the atmosphere which is almost certainly due to human activity: industry, transportation, and increased population.
CORRELATION: Very strong
|
|
|
WHERE HAVE GHG EMISSIONS COME FROM?
|
GO TOP
|
Tracing anthropogenic carbon dioxide and methane emissions to fossil fuel and cement producers, 1854–2010 ... by Richard Heede
Richard Heede states that the purpose of the analysis is to understand the historic emissions as a factual matter, and to invite consideration of their possible relevance to public policy. This is a valuable input for the radical accountability that is part of the TVM framework for value management in the modern socio-enviro-econmic system.
This paper presents a quantitative analysis of the historic fossil fuel and cement production records of the 50 leading investor-owned, 31 state-owned, and 9 nation-state producers of oil, natural gas, coal, and cement from as early as 1854 to 2010.
The analysis traces emissions totaling 914 GtCO2e — 63 % of cumulative worldwide emissions of industrial CO2 and methane between 1751 and 2010—to the 90 “carbon major” entities based on the carbon content of marketed hydrocarbon fuels (subtracting for non-energy uses), process CO2 from cement manufacture, CO2 from flaring, venting, and own fuel use, and fugitive or vented methane.
Cumulatively, emissions of 315 GtCO2e have been traced to investor-owned entities, 288 GtCO2e to state-owned enterprises, and 312 GtCO2e to nation-states.
Of these emissions, half has been emitted since 1986.
The carbon major entities possess fossil fuel reserves that will, if produced and emitted, intensify anthropogenic climate change.
The world at large needs to know that while the production and sale of energy products has generated substantial profits during the industrial era which have been distributed to stockholders and made them wealthy, the cost of mitigating the damage and building resilience for the future is most likely going to be much more. If the same valuation methodology is applied to the energy sector that is used for the conventional financial valuation of an individual company, the sector is already bankrupt!
|
GHG-emissions-history-1854–2010-by-Richard-Heede-2013.pdf
'http://truevaluemetrics.org/DBpdfs/ClimateChange/GHG-emissions-history-1854–2010-by-Richard-Heede-2013.pdf'
|
Open PDF ... GHG-emissions-history-1854–2010-by-Richard-Heede-2013
|
|
GHG EMISSIONS ATTRIBUTED TO MAJOR ORGANIZATIONS
|
|
|
Entity
|
2010 emissions
MtCO2e
|
Cumulative 1854–2010
MtCO2e
|
% global emissions
1751–2010
|
|
1.
|
Chevron, USA
|
423
|
51,096
|
3.52 %
|
|
2.
|
ExxonMobil, USA
|
655
|
46,672
|
3.22 %
|
|
3.
|
Saudi Aramco, Saudi Arabia
|
1,550
|
46,033
|
3.17 %
|
|
4.
|
BP, UK
|
554
|
35,837
|
2.47 %
|
|
5.
|
Gazprom, Russian Federation
|
1,371
|
32,136
|
2.22 %
|
|
6.
|
Royal Dutch/Shell, Netherlands
|
478
|
30,751
|
2.12 %
|
|
7.
|
National Iranian Oil Company
|
867
|
29,084
|
2.01 %
|
|
8.
|
Pemex, Mexico
|
602
|
20,025
|
1.38 %
|
|
9.
|
ConocoPhillips, USA
|
359
|
16,866
|
1.16 %
|
|
10.
|
Petroleos de Venezuela
|
485
|
16,157
|
1.11 %
|
|
11.
|
Coal India
|
830
|
15,493
|
1.07 %
|
|
12.
|
Peabody Energy, USA
|
519
|
12,432
|
0.86 %
|
|
13.
|
Total, France
|
398
|
11,911
|
0.82 %
|
|
14.
|
PetroChina, China
|
614
|
10,564
|
0.73 %
|
|
15.
|
Kuwait Petroleum Corp.
|
323
|
10,503
|
0.73 %
|
|
16.
|
Abu Dhabi NOC, UAE
|
387
|
9,672
|
0.67 %
|
|
17.
|
Sonatrach, Algeria
|
386
|
9,263
|
0.64 %
|
|
18.
|
Consol Energy, Inc., USA
|
160
|
9,096
|
0.63 %
|
|
19.
|
BHP-Billiton, Australia
|
320
|
7,606
|
0.52 %
|
|
20.
|
Anglo American, United Kingdom
|
242
|
7,242
|
0.50 %
|
The goal of TVM is to help 'move the needle' on all the important issues that make the modern world inequitable and unsustainable. This academic work is a valuable foundation for one of the comonents of TVM ... the idea of radical accountability.
One of the characteristics of a conventional financial balance sheet is that it reflects the history of the entity. The TVM balance sheet reflects the social impact, the environmental impact and the economic that is embedded in the current state of the entity.
This makes it possible to associate these major issues that have accumulated over time into the current state of everything ... where everything can be a company, a product, a place, and country or an individual. This has the potential to be very powerful, and to change the way success is perceived.
|
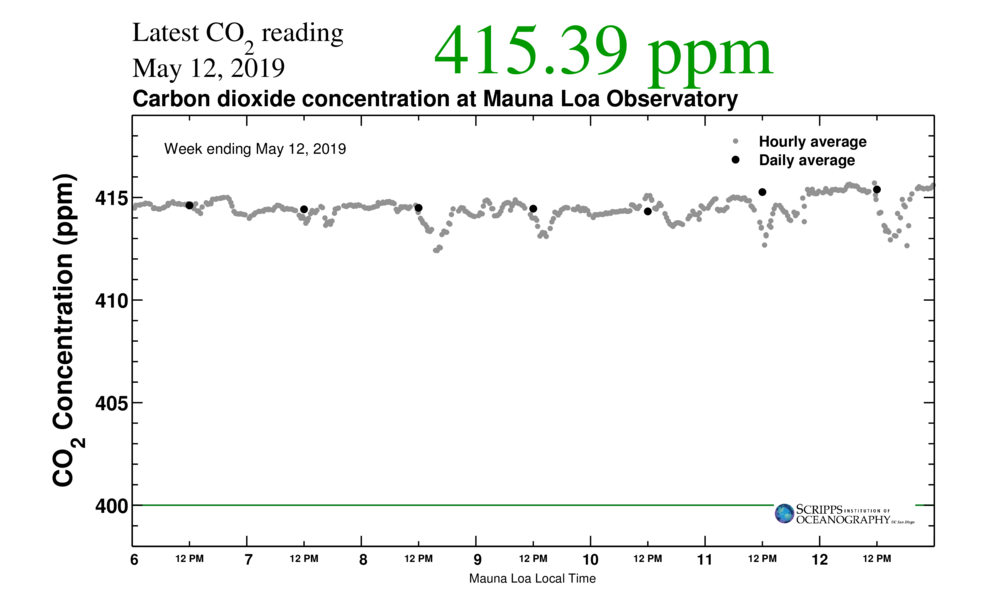
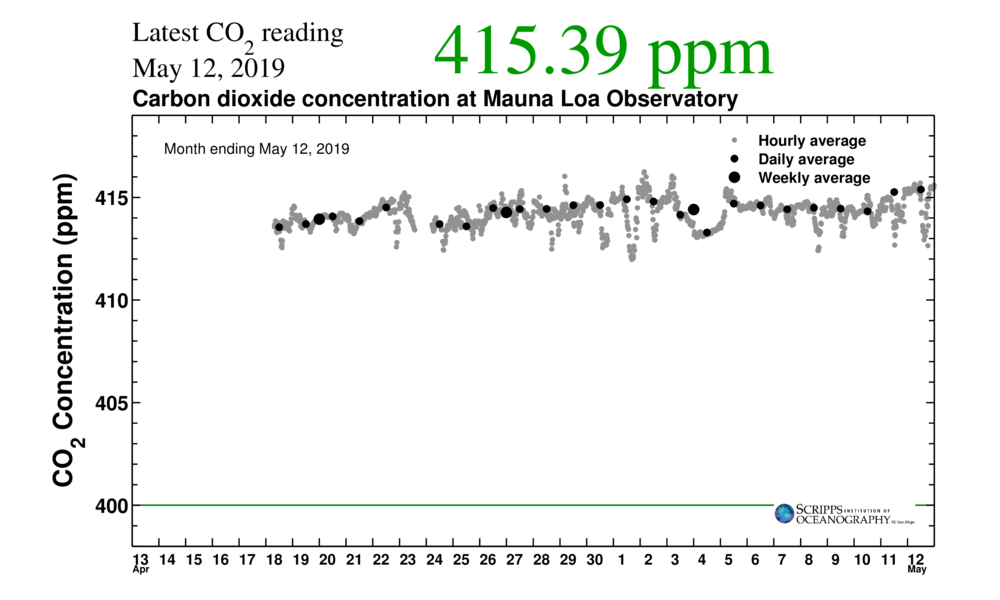
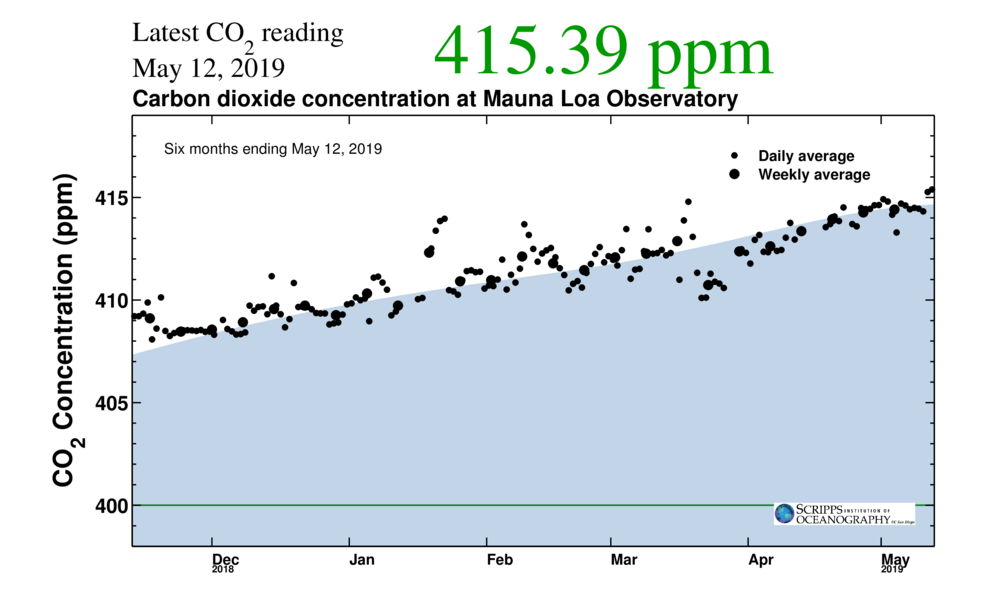
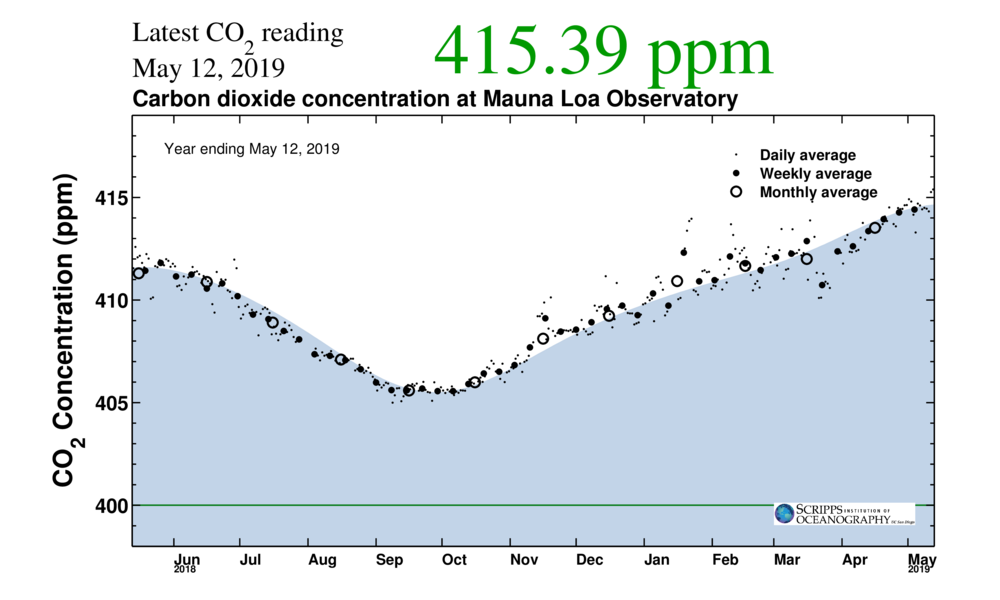
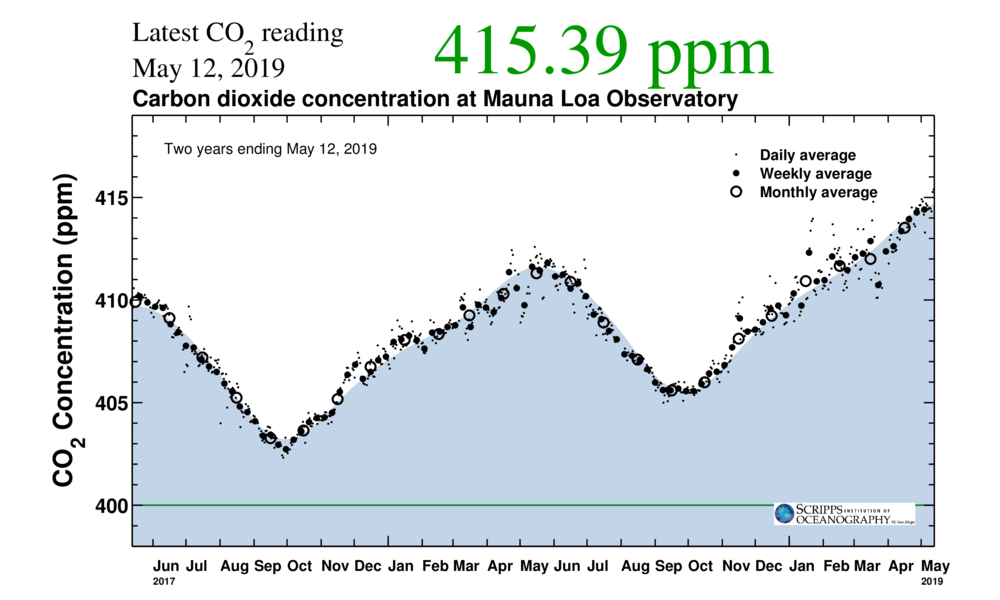
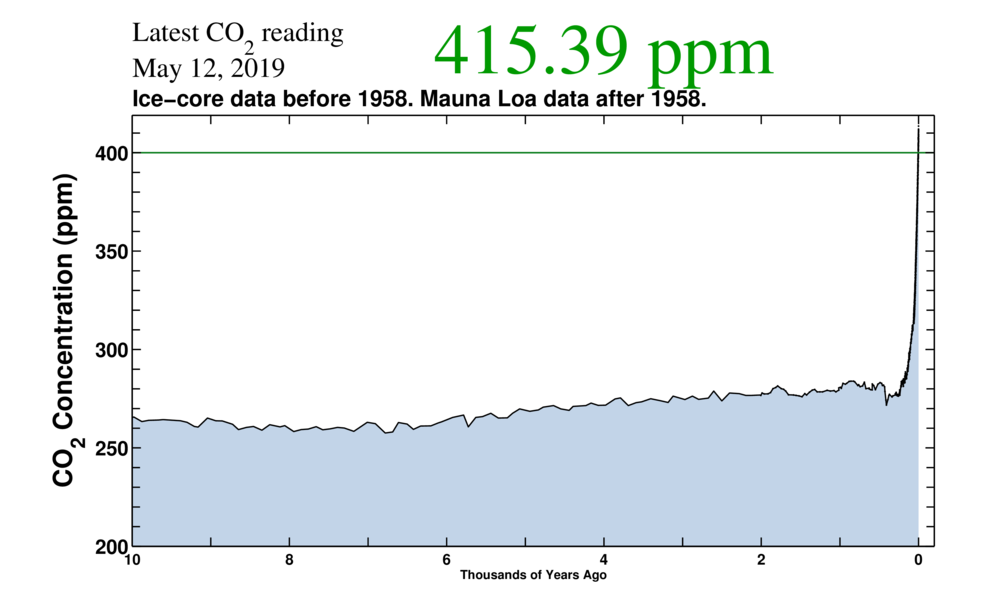
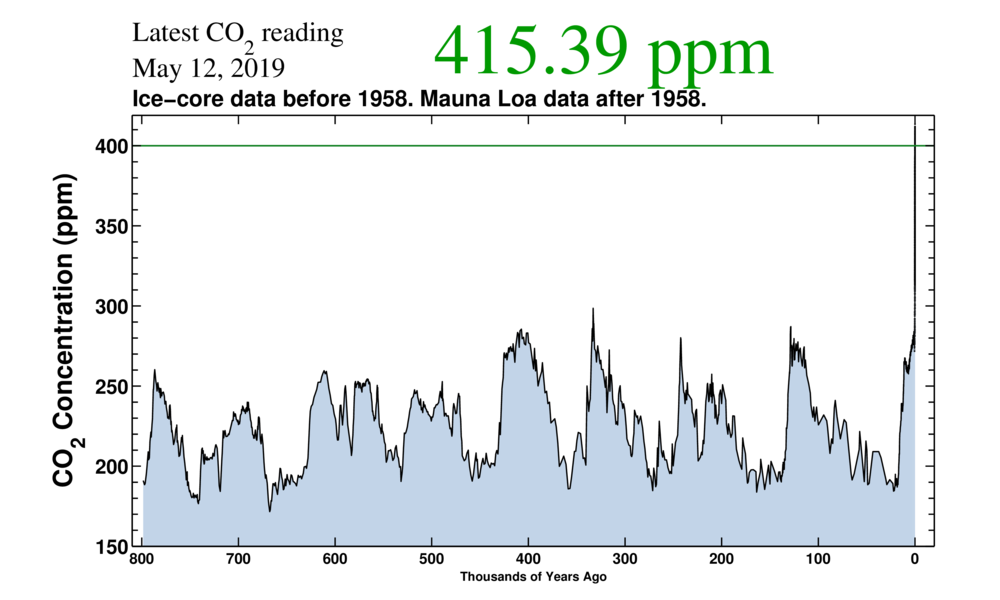
Atmospheric CO2 levels (ppm) from the Scripps Institution
Record of atmospheric carbon dioxide from Scripps Institution of Oceanography (UC San Diego)
|
|
CO2 concentrations in the atmosphere as measured at the Mauna Loa laboratory
https://scripps.ucsd.edu/programs/keelingcurve/
|
Open External link
|
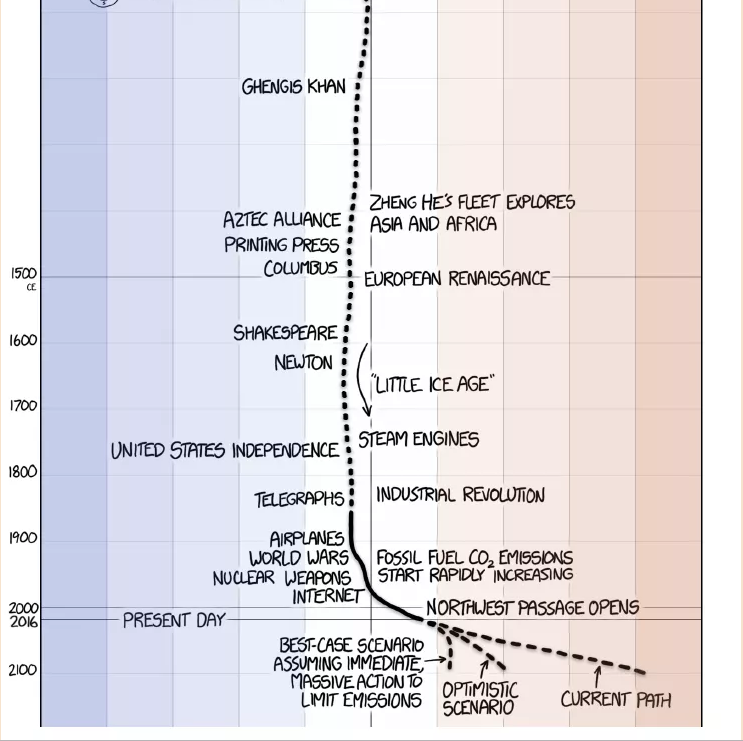
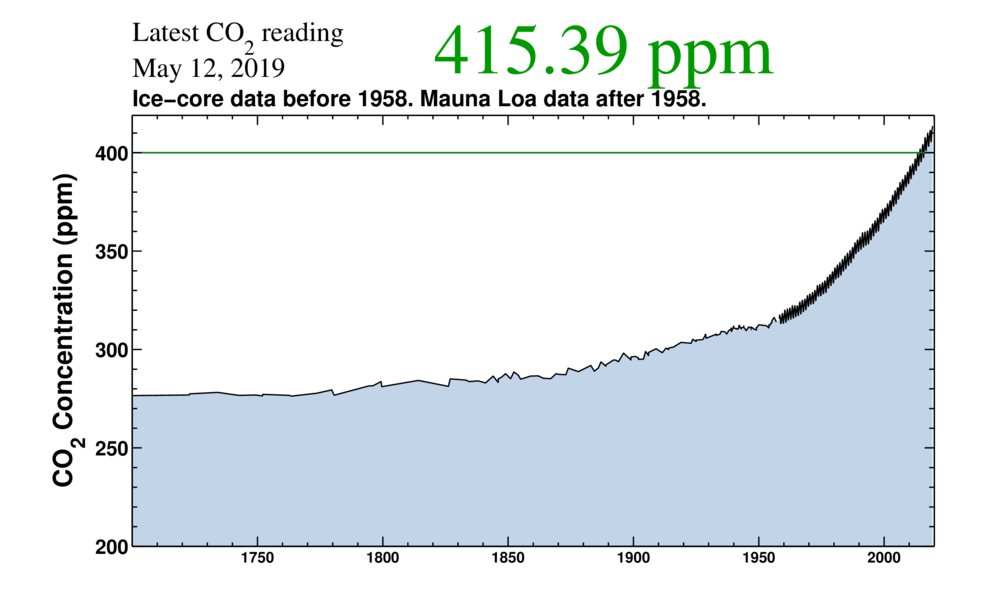
A 10,000 year perspective
|
This perspective makes it pretty clear that leaders of the the modern world should be paying attention to the impact the materialist consumption society is having on the natural world that is the foundation of all sustainable living. The increase in CO2 concentrations in the atmosphere have literally gone 'off the chart' in the last few decades. The concentration was between 250 and 270 parts per million (ppm) for 10,000 years, and now over a relatively few decades has increased to more the 400 ppm.
|
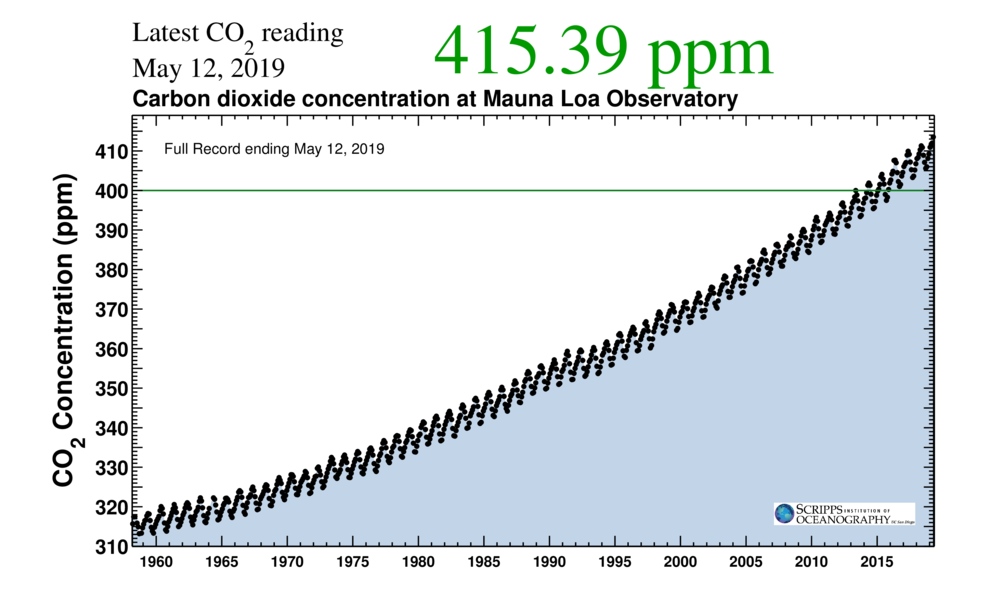
The Last 300 Years
|
The industrial revolution which made it possible for humankind to live a far better quality of life than previously at any time in history was enabled by energy, but energy has significantly disrupted the CO2 cycle in nature creating an increased concentration of CO2 in the atmosphere.
|
|
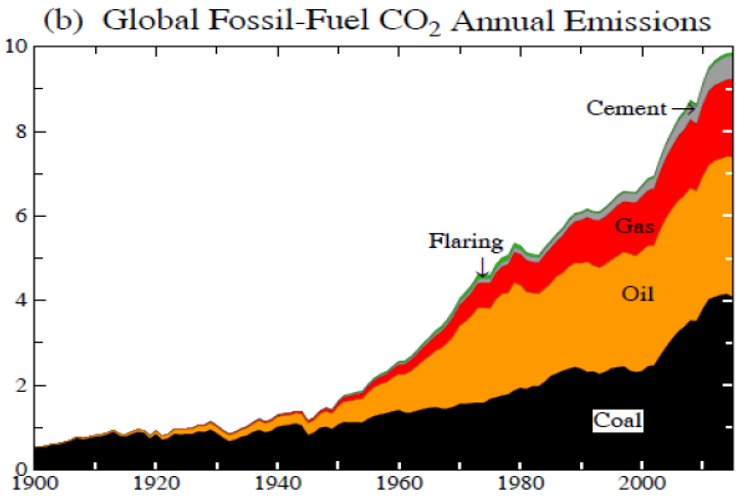
CO2 Emissions from Fossil Fuels
|
|
There has been a huge increase in emissions since the end of WWII ... almost 10 times. In the previous 50 years emissions had grown, but relativley quite slowly, and from a much smaller base.
The conundrum that has to be addressed is that while the increase in emissions of GHGs is a problem, the increase in the use of energy by the population of the world is a good thing and is the foundation for people in general to have a better quality of life.
|
James-Hansen-ACPD-Climate-Change-Impacts-15-20059-2015
Ice melt, sea level rise and superstorms: evidence from paleoclimate data, climate modeling, and modern observations that 2◦C global warming is highly dangerous
Abstract
There is evidence of ice melt, sea level rise to +5–9 m, and extreme storms in the prior
interglacial period that was less than 1 ◦C warmer than today. Human-made climate
forcing is stronger and more rapid than paleo forcings, but much can be learned by
5 combining insights from paleoclimate, climate modeling, and on-going observations.
We argue that ice sheets in contact with the ocean are vulnerable to non-linear disintegration
in response to ocean warming, and we posit that ice sheet mass loss can be
approximated by a doubling time up to sea level rise of at least several meters. Doubling
times of 10, 20 or 40 years yield sea level rise of several meters in 50, 100 or
10 200 years. Paleoclimate data reveal that subsurface ocean warming causes ice shelf
melt and ice sheet discharge. Our climate model exposes amplifying feedbacks in the
Southern Ocean that slow Antarctic bottom water formation and increase ocean temperature
near ice shelf grounding lines, while cooling the surface ocean and increasing
sea ice cover and water column stability. Ocean surface cooling, in the North Atlantic
15 as well as the Southern Ocean, increases tropospheric horizontal temperature gradients,
eddy kinetic energy and baroclinicity, which drive more powerful storms. We focus
attention on the Southern Ocean’s role in affecting atmospheric CO2 amount, which in
turn is a tight control knob on global climate. The millennial (500–2000 year) time scale
of deep ocean ventilation affects the time scale for natural CO2 change, thus the time
20 scale for paleo global climate, ice sheet and sea level changes. This millennial carbon
cycle time scale should not be misinterpreted as the ice sheet time scale for response
to a rapid human-made climate forcing. Recent ice sheet melt rates have a doubling
time near the lower end of the 10–40 year range. We conclude that 2 ◦C global warming
above the preindustrial level, which would spur more ice shelf melt, is highly danger25
ous. Earth’s energy imbalance, which must be eliminated to stabilize climate, provides
a crucial metric
|
http://www.atmos-chem-phys-discuss.net/15/20059/2015/acpd-15-20059-2015.pdf
'http://www.truevaluemetrics.org/DBpdfs/People/JamesHansen/James-Hansen-ACPD-Climate-Change-Impacts-15-20059-2015.pdf'
|
Open PDF ...
James-Hansen-ACPD-Climate-Change-Impacts-15-20059-2015
|
CLIMATE CHANGE ... Hansen etal predictions 2015
RISK-p3-14 ... Some highlights from the Hansen etal report of 2015
James Hansen and many other scientists have been working on the matter of climate change for a long time. Climate change is very complicated, but the evidence is that we are facing change that has not been seen in MILLIONS of years. We are not facing a 100 year storm, but a disruption that happens only a few times in the life of the planet. This Hansen report should be a wake up call to decision makers. It further justifies the MDIA rethink of how we do metrics about all decision making and the accounting for risk.
|
|
'http://www.slideshare.net/PeterBurgess2/risk-p314-climate-change-hansen-et-al-predictions-2015-150814'
|
Open in slideshare
|
|
Hansen et al on Climate Change
|
Hansen-etal ... Get-carbon-out-of-the-atmosphere-2016
Young People’s Burden: Requirement of Negative CO2 Emissions
Abstract ... Published: 4 October 2016
The rapid rise of global temperature that began about 1975 continues at a mean rate of about
0.18°C/decade, with the current annual temperature exceeding +1.25°C relative to 1880-1920.
Global temperature has just reached a level similar to the mean level in the prior interglacial
25 (Eemian) period, when sea level was several meters higher than today, and, if it long remains at
this level, slow amplifying feedbacks will lead to greater climate change and consequences. The
growth rate of climate forcing due to human-caused greenhouse gases (GHGs) increased over
20% in the past decade mainly due to resurging growth of atmospheric CH4, thus making it
increasingly difficult to achieve targets such as limiting global warming to 1.5°C or reducing
30 atmospheric CO2 below 350 ppm. Such targets now require “negative emissions”, i.e., extraction
of CO2 from the atmosphere. If rapid phasedown of fossil fuel emissions begins soon, most of
the necessary CO2 extraction can take place via improved agricultural and forestry practices,
including reforestation and steps to improve soil fertility and increase its carbon content. In this
case, the magnitude and duration of global temperature excursion above the natural range of the
35 current interglacial (Holocene) could be limited and irreversible climate impacts could be
minimized. In contrast, continued high fossil fuel emissions by the current generation would
place a burden on young people to undertake massive technological CO2 extraction, if they are to
limit climate change. Proposed methods of extraction such as bioenergy with carbon capture and
storage (BECCS) or air capture of CO2 imply minimal estimated costs of 104-570 trillion dollars
40 this century, with large risks and uncertain feasibility. Continued high fossil fuel emissions
unarguably sentences young people to either a massive, possibly implausible cleanup or growing
deleterious climate impacts or both, scenarios that should provide both incentive and obligation
for governments to alter energy policies without further delay
|
|
FONT SIZE = 2 color = black font face = 'Arial'>
'http://truevaluemetrics.org/DBpdfs/Carbon/Hansen-etal-Get-carbon-out-of-the-atmosphere-2016.pdf'
|
Open PDF ...
Hansen-etal-Get-carbon-out-of-the-atmosphere-2016.pdf
|
James-Hansen-ACPD-Climate-Change-Impacts-15-20059-2015
'http://truevaluemetrics.org/DBpdfs//People/JamesHansen/James-Hansen-ACPD-Climate-Change-Impacts-15-20059-2015.pdf'
|
Open PDF ...
James-Hansen-ACPD-Climate-Change-Impacts-15-20059-2015
|
ACPD-Report-Hansen-etal-2015
'http://truevaluemetrics.org/DBpdfs/ClimateChange/ACPD/ACPD-Report-Hansen-etal-2015.pdf'
|
Open PDF ...
ACPD-Report-Hansen-etal-2015
|
CLIMATE CHANGE ... Hansen etal predictions 2015
James Hansen and many other scientists have been working on the matter of climate change for a long time. Climate change is very complicated, but the evidence is that we are facing change that has not been seen in MILLIONS of years. We are not facing a 100 year storm, but a disruption that happens only a few times in the life of the planet. This Hansen report should be a wake up call to decision makers. It further justifies the MDIA rethink of how we do metrics about all decision making and the accounting for risk. ...
RISK-p3-14 ... Some highlights from the Hansen etal report of 2015
|
Open in slideshare
|
TEN CLEAR INDICATORS OUR CLIMATE IS CHANGING
How do we know our climate is changing permanently, rather than just going through a normal period of flux? Let’s look at 10 major changes scientists have seen in our climate system to help set the record straight.
Few global trends have been as controversial as climate change and the Earth’s warming. The Earth has gone through many shifts in cooling and warming driven by natural factors like the sun’s energy or variations in its orbit, but the trend scientists have seen over the past 50 years is unmistakable.
Let’s take a closer look: globally, average surface temperatures increased 1.1—1.6 degrees Fahrenheit (0.6—0.9 degrees Celsius) between 1906 and 2005. However, it’s the rate of temperature change that’s especially troubling to scientists; temperatures have risen nearly twice as fast in the last 50 years alone.
What other ways has our climate system changed in the last century? How do we really know our climate is changing permanently, rather than just going through a normal period of flux? Between opinions from climate deniers and misinformation campaigns from the fossil fuel industry, it can be a challenge to get the unobstructed facts.
So to help set the record straight, we’re going to focus on 10 major changes scientists have seen in our climate system. Each indicator described below has been extensively studied over the past several decades, and was captured from many different data sets and technologies.
|
|
Link to resources related to Climate Reality Project
|
Open L0500-Climate-Reality-Project
|
CLIMATE CHANGE ... SOME OF THE DATA
MDIA-p3-14 ... Some graphs and commentary from the Climate Reality Project
| Open in slideshare
|
|
|
How climate is changing
From NASA ??? 2015 ???
|
GO TOP
|
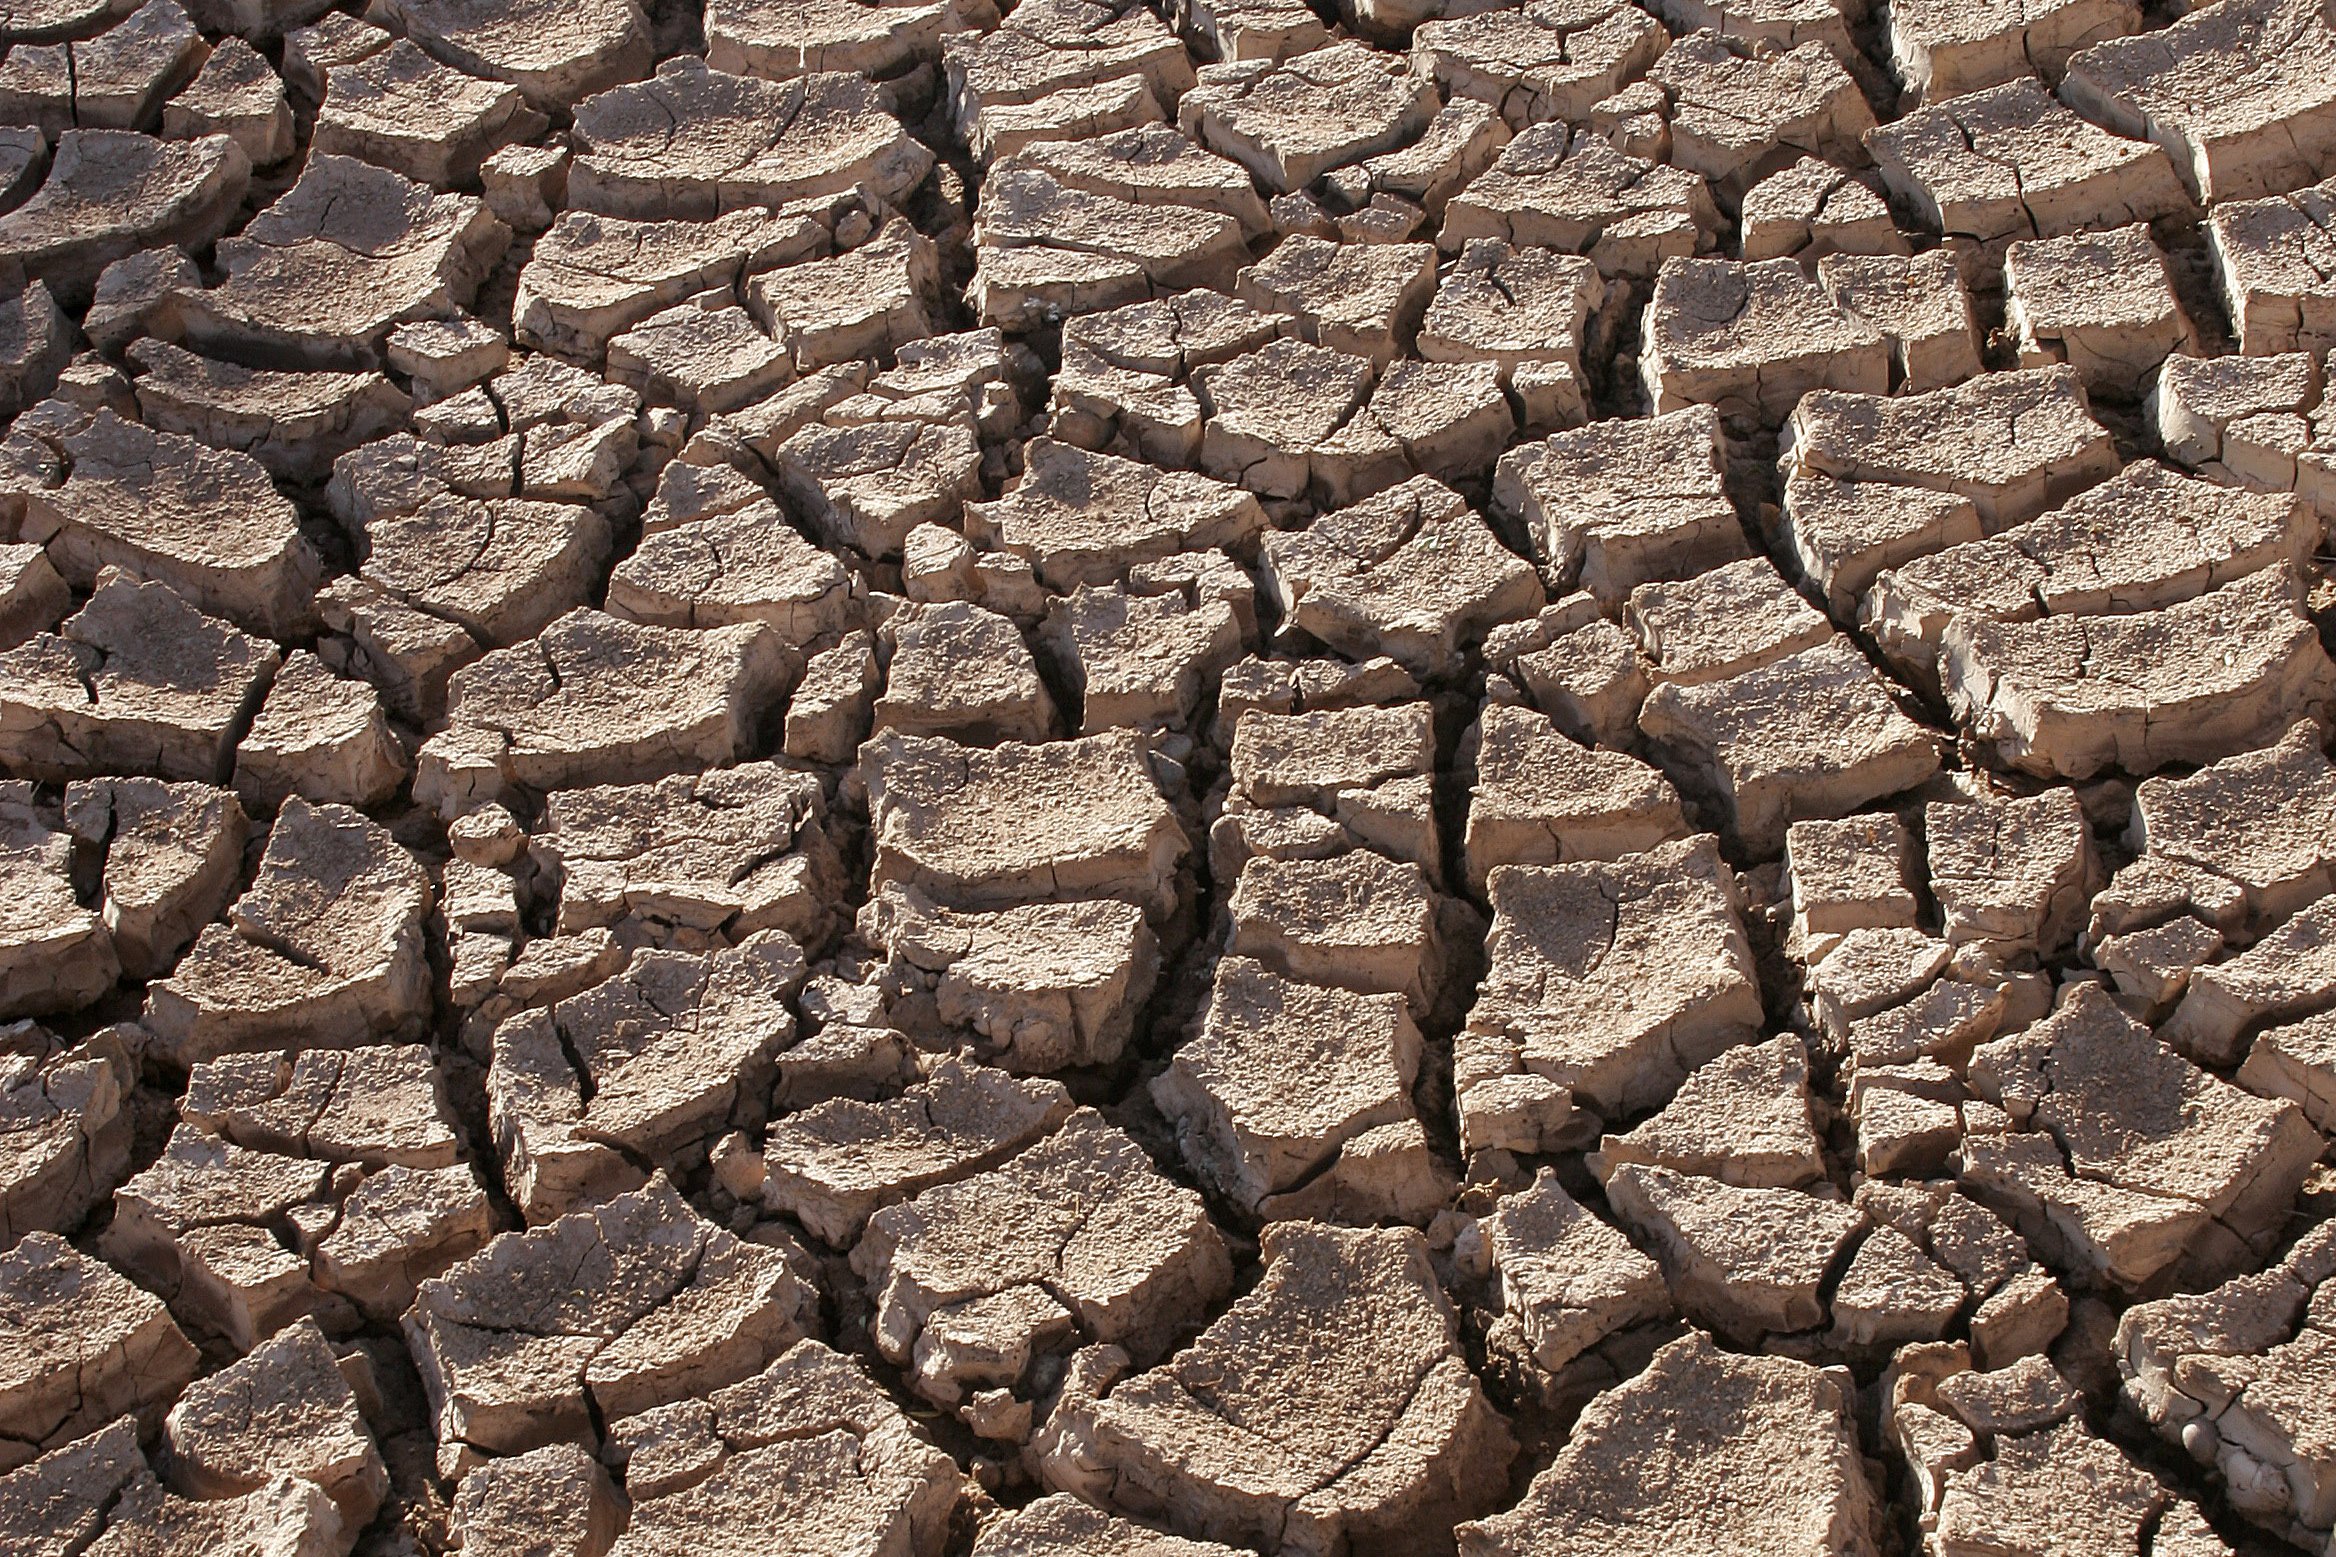
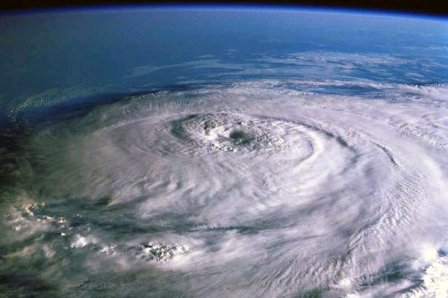
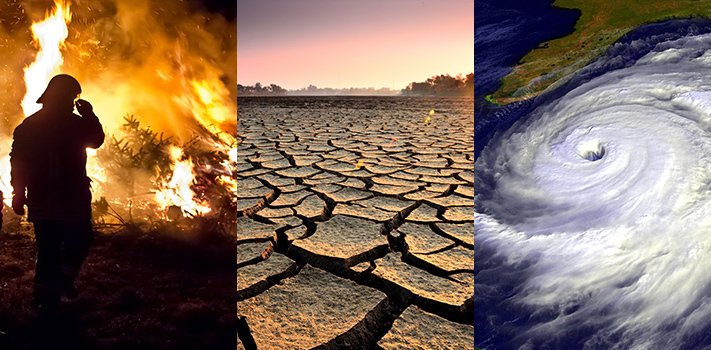 Credit: Left - Mellimage/Shutterstock.com, center - Montree Hanlue/Shutterstock.com, right - NASA
|
How climate is changing
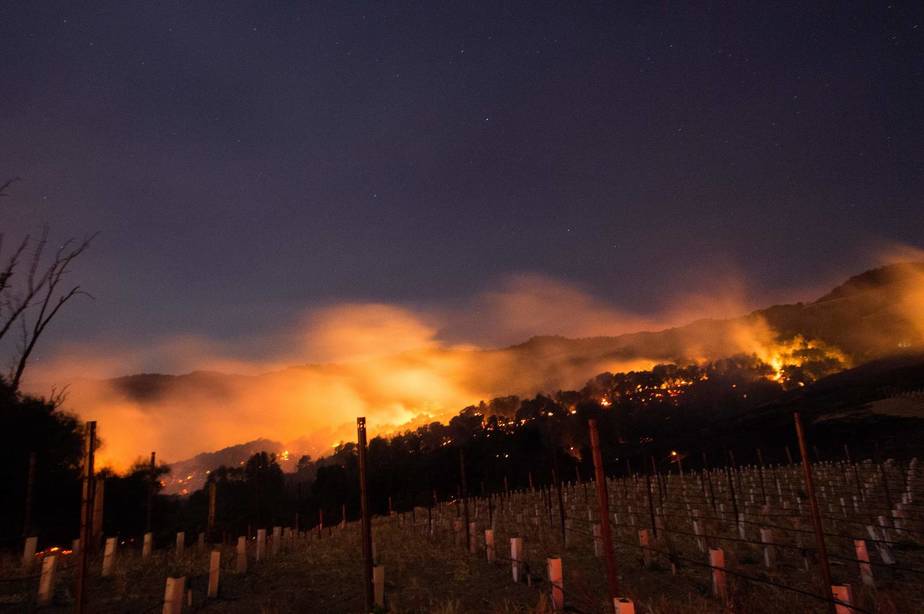
The potential future effects of global climate change include more frequent wildfires, longer periods of drought in some regions and an increase in the number, duration and intensity of tropical storms.
Global climate change has already had observable effects on the environment. Glaciers have shrunk, ice on rivers and lakes is breaking up earlier, plant and animal ranges have shifted and trees are flowering sooner.
Effects that scientists had predicted in the past would result from global climate change are now occurring: loss of sea ice, accelerated sea level rise and longer, more intense heat waves.
Taken as a whole, the range of published evidence indicates that the net damage costs of climate change are likely to be significant and to increase over time.
- Intergovernmental Panel on Climate Change
Scientists have high confidence that global temperatures will continue to rise for decades to come, largely due to greenhouse gases produced by human activities. The Intergovernmental Panel on Climate Change (IPCC), which includes more than 1,300 scientists from the United States and other countries, forecasts a temperature rise of 2.5 to 10 degrees Fahrenheit over the next century.
According to the IPCC, the extent of climate change effects on individual regions will vary over time and with the ability of different societal and environmental systems to mitigate or adapt to change.
The IPCC predicts that increases in global mean temperature of less than 1.8 to 5.4 degrees Fahrenheit (1 to 3 degrees Celsius) above 1990 levels will produce beneficial impacts in some regions and harmful ones in others. Net annual costs will increase over time as global temperatures increase.
'Taken as a whole,' the IPCC states, 'the range of published evidence indicates that the net damage costs of climate change are likely to be significant and to increase over time.' 1-2
|
How climate is changing ... future effects
Some of the long-term effects of global climate change in the United States are as follows, according to the Third and Fourth National Climate Assessment Reports:
https://climate.nasa.gov/effects/
|
Open external link
|
|
Change will continue through this century and beyond
|
|
Global climate is projected to continue to change over this century and beyond. The magnitude of climate change beyond the next few decades depends primarily on the amount of heat-trapping gases emitted globally, and how sensitive the Earth’s climate is to those emissions.
+ MORE
|
|
Temperatures will continue to rise
|

|
Because human-induced warming is superimposed on a naturally varying climate, the temperature rise has not been, and will not be, uniform or smooth across the country or over time.
+ MORE
|
|
Frost-free season (and growing season) will lengthen
|

|
The length of the frost-free season (and the corresponding growing season) has been increasing nationally since the 1980s, with the largest increases occurring in the western United States, affecting ecosystems and agriculture. Across the United States, the growing season is projected to continue to lengthen.
In a future in which heat-trapping gas emissions continue to grow, increases of a month or more in the lengths of the frost-free and growing seasons are projected across most of the U.S. by the end of the century, with slightly smaller increases in the northern Great Plains. The largest increases in the frost-free season (more than eight weeks) are projected for the western U.S., particularly in high elevation and coastal areas. The increases will be considerably smaller if heat-trapping gas emissions are reduced.
+ MORE
|
|
Changes in precipitation patterns
|
|
Average U.S. precipitation has increased since 1900, but some areas have had increases greater than the national average, and some areas have had decreases. More winter and spring precipitation is projected for the northern United States, and less for the Southwest, over this century.
Projections of future climate over the U.S. suggest that the recent trend towards increased heavy precipitation events will continue. This trend is projected to occur even in regions where total precipitation is expected to decrease, such as the Southwest.
+ MORE
|
|
More droughts and heat waves
|
|
Droughts in the Southwest and heat waves (periods of abnormally hot weather lasting days to weeks) everywhere are projected to become more intense, and cold waves less intense everywhere.
Summer temperatures are projected to continue rising, and a reduction of soil moisture, which exacerbates heat waves, is projected for much of the western and central U.S. in summer. By the end of this century, what have been once-in-20-year extreme heat days (one-day events) are projected to occur every two or three years over most of the nation.
+ MORE
|
|
Hurricanes will become stronger and more intense
|
|
The intensity, frequency and duration of North Atlantic hurricanes, as well as the frequency of the strongest (Category 4 and 5) hurricanes, have all increased since the early 1980s. The relative contributions of human and natural causes to these increases are still uncertain. Hurricane-associated storm intensity and rainfall rates are projected to increase as the climate continues to warm.
+ MORE
|
|
Sea level will rise 1-4 feet by 2100
|
|
Global sea level has risen by about 8 inches since reliable record keeping began in 1880. It is projected to rise another 1 to 4 feet by 2100. This is the result of added water from melting land ice and the expansion of seawater as it warms.
In the next several decades, storm surges and high tides could combine with sea level rise and land subsidence to further increase flooding in many regions. Sea level rise will continue past 2100 because the oceans take a very long time to respond to warmer conditions at the Earth’s surface. Ocean waters will therefore continue to warm and sea level will continue to rise for many centuries at rates equal to or higher than those of the current century.
+ MORE
|
|
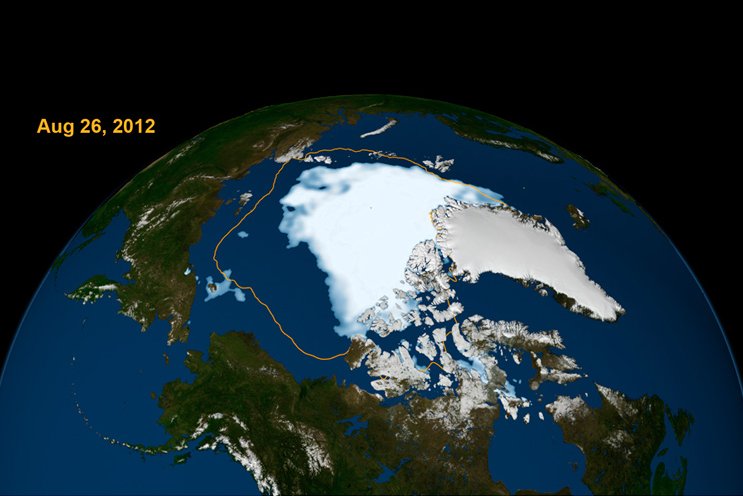
Arctic likely to become ice-free
|
|
The Arctic Ocean is expected to become essentially ice free in summer before mid-century.
+ MORE
|
|
U.S. regional effects
|
Below are some of the impacts that are currently visible throughout the U.S. and will continue to affect these regions, according to the Third3 and Fourth4 National Climate Assessment Reports, released by the U.S. Global Change Research Program:
Northeast. Heat waves, heavy downpours and sea level rise pose growing challenges to many aspects of life in the Northeast. Infrastructure, agriculture, fisheries and ecosystems will be increasingly compromised. Many states and cities are beginning to incorporate climate change into their planning.
Northwest. Changes in the timing of streamflow reduce water supplies for competing demands. Sea level rise, erosion, inundation, risks to infrastructure and increasing ocean acidity pose major threats. Increasing wildfire, insect outbreaks and tree diseases are causing widespread tree die-off.
Southeast. Sea level rise poses widespread and continuing threats to the region’s economy and environment. Extreme heat will affect health, energy, agriculture and more. Decreased water availability will have economic and environmental impacts.
Midwest. Extreme heat, heavy downpours and flooding will affect infrastructure, health, agriculture, forestry, transportation, air and water quality, and more. Climate change will also exacerbate a range of risks to the Great Lakes.
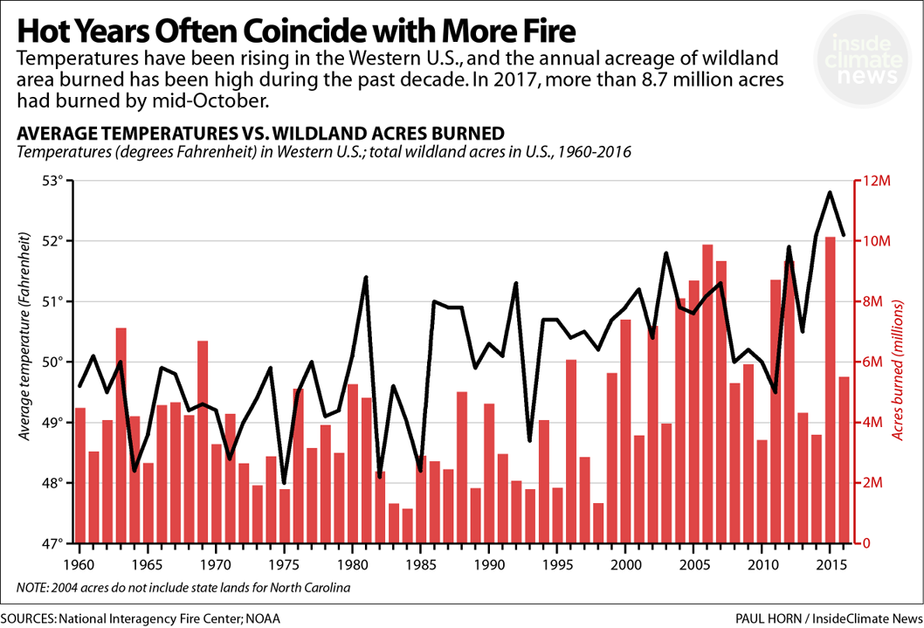
Southwest. Increased heat, drought and insect outbreaks, all linked to climate change, have increased wildfires. Declining water supplies, reduced agricultural yields, health impacts in cities due to heat, and flooding and erosion in coastal areas are additional concerns.
|
References
IPCC 2007, Summary for Policymakers, in Climate Change 2007: Impacts, Adaptation and Vulnerability. Contribution of Working Group II to the Fourth Assessment Report of the Intergovernmental Panel on Climate Change, Cambridge University Press, Cambridge, UK, p. 17.
IPCC, 2013: Summary for Policymakers. In: Climate Change 2013: The Physical Science Basis. Contribution of Working Group I to the Fifth Assessment Report of the Intergovernmental Panel on Climate Change [Stocker, T.F., D. Qin, G.-K. Plattner, M. Tignor, S.K. Allen, J. Boschung, A. Nauels, Y. Xia, V. Bex and P.M. Midgley (eds.)]. Cambridge University Press, Cambridge, United Kingdom and New York, NY, USA.
USGCRP 2014, Third Climate Assessment.
USGCRP 2017, Fourth Climate Assessment.
|
|
A degree of difference
|
A degree of difference
So, the Earth's average temperature has increased about 2 degrees Fahrenheit during the 20th century. What's the big deal?
Two degrees may sound like a small amount, but it's an unusual event in our planet's recent history. Earth's climate record, preserved in tree rings, ice cores, and coral reefs, shows that the global average temperature is stable over long periods of time. Furthermore, small changes in temperature correspond to enormous changes in the environment.
For example, at the end of the last ice age, when the Northeast United States was covered by more than 3,000 feet of ice, average temperatures were only 5 to 9 degrees cooler than today.
Find out more
The U.S. Global Change Research Program's Third Assessment Report
The IPCC's 2014 report on climate change impacts, adaptation and vulnerability
Latest resources
Summer blooms in the Baltic
Summer blooms in the Baltic
Video: For 15 years, GRACE tracked freshwater movements around the world
Video: For 15 years, GRACE tracked freshwater movements around the world
NASA studies an unusual Arctic warming event
NASA studies an unusual Arctic warming event
|
Heat Check ... Extreme heat kills more than a hundred New Yorkers yearly.

|
|
Here's how the city's tackling the problem in a warming world.
|
Open file 15469
|
|
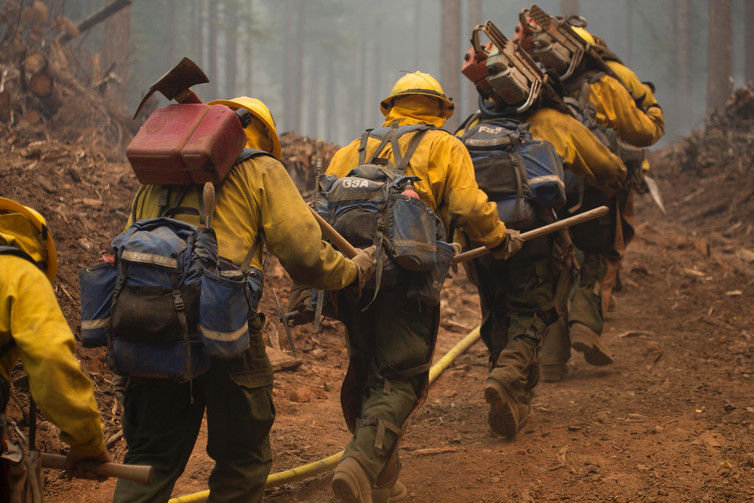
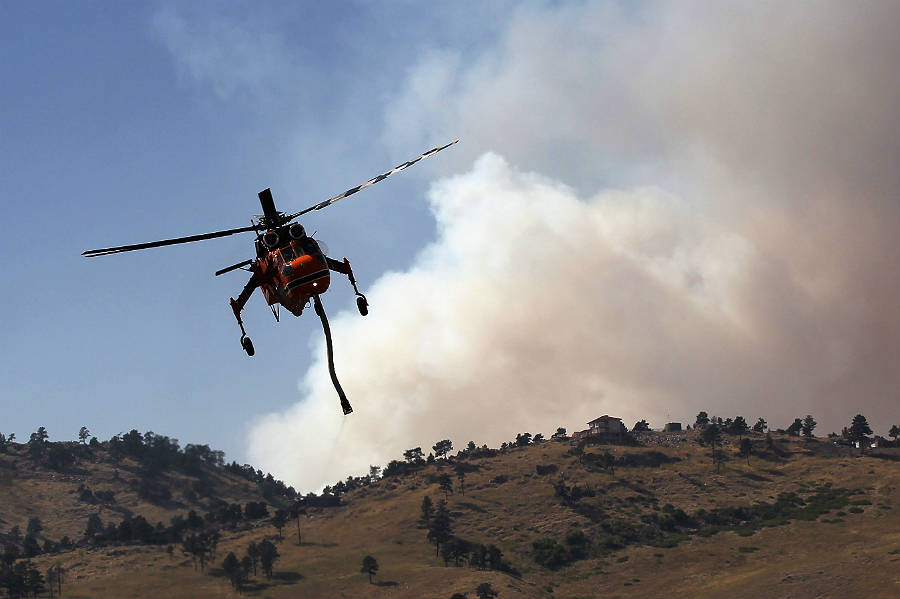
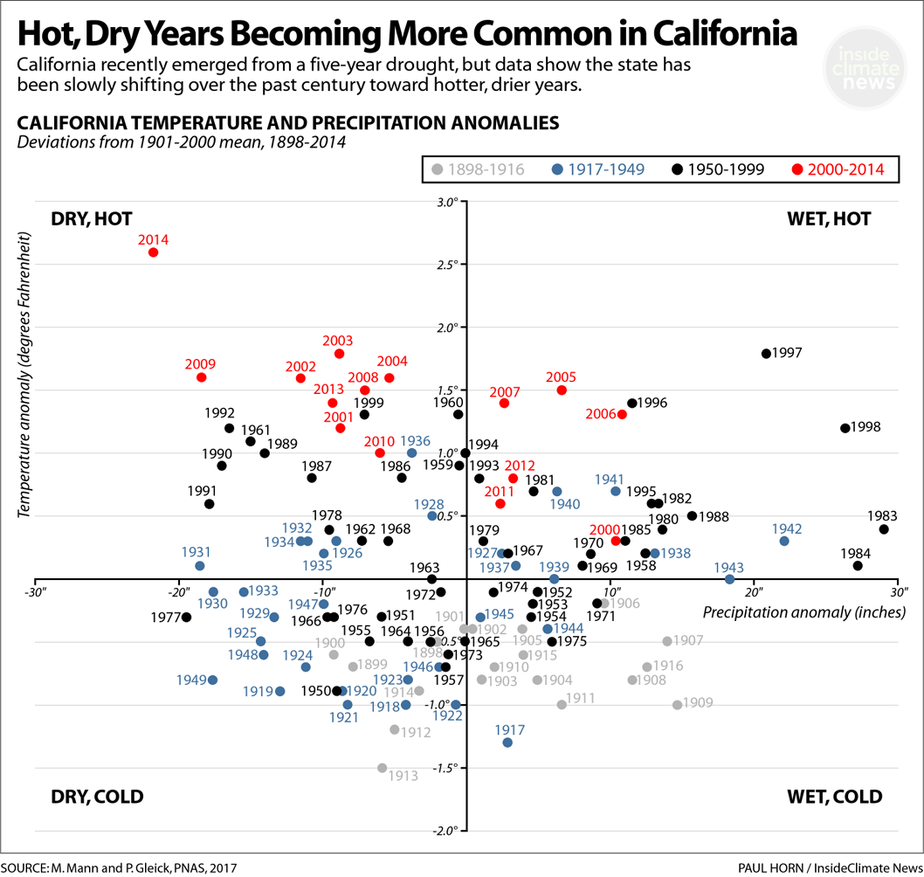
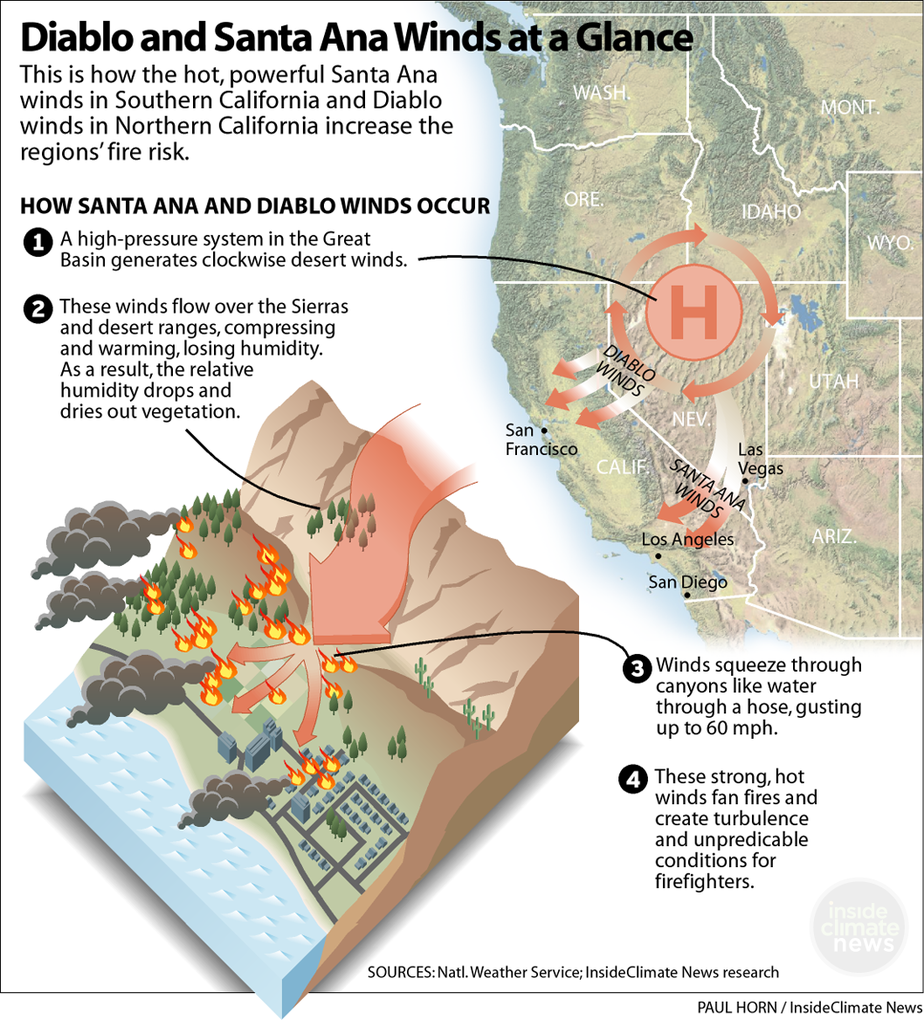
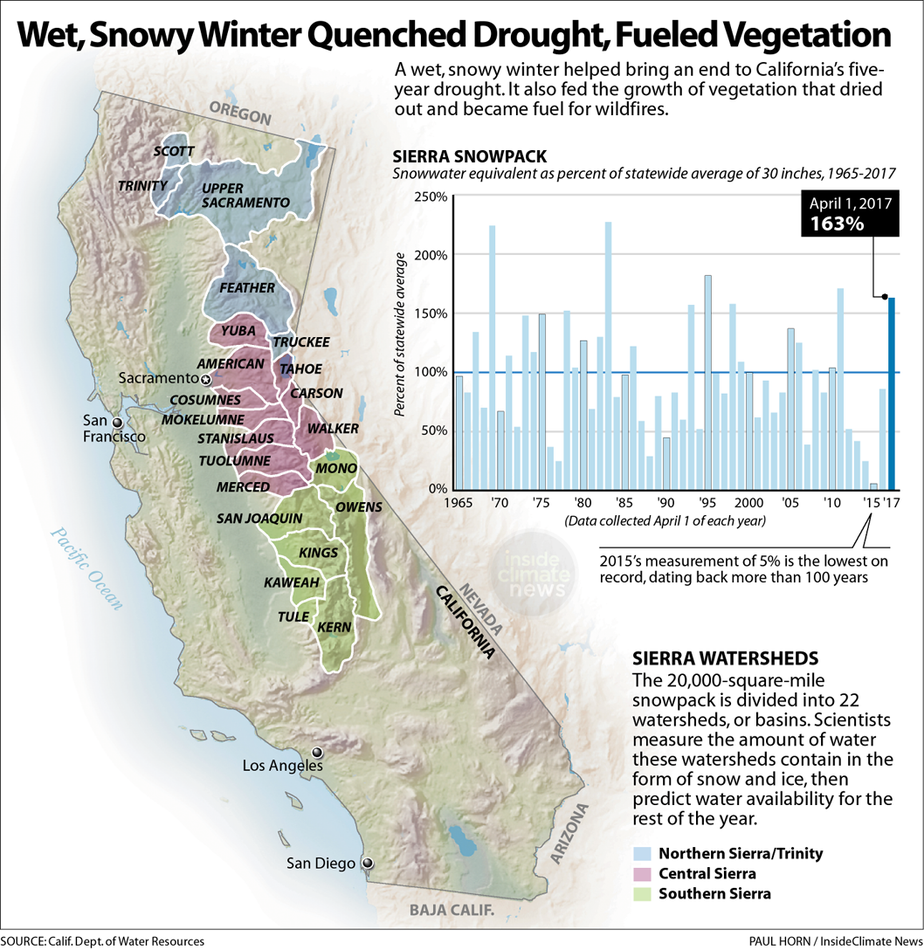
Wildfires in California and the American West
|
Global-Commission-on-Adaption-2019-Report
We face a crisis.
Climate change is upon us, and its impacts are getting more severe with each passing year.
Global actions to slow climate change are promising but insufficient. We must invest in a massive effort to adapt to conditions that are now inevitable: higher temperatures, rising
seas, fiercer storms, more unpredictable rainfall, and more acidic oceans.
We are not starting from a standstill. There are many bright spots where adaptation efforts have begun—but we need more urgency, innovation, and scale.
Adaptation is not an alternative to a redoubled effort to stop climate change, but an essential complement to it. Failing to lead and act on adaptation will result in a huge economic and human toll, causing widespread increases in poverty and severely undermining long-term global economic prospects.
The good news is that adaptation, done right, will lead to better growth and development.
It will also save lives, protect nature, reduce inequalities, and create opportunities.
We can do it
'http://truevaluemetrics.org/DBpdfs/ClimateCrisis/Global-Commission-on-Adaption-2019-Report.pdf'
|
Open PDF ...
Global-Commission-on-Adaption-2019-Report
|
|
|
DATA ABOUT CLIMATE CHANGE
Climate change has been taking place ... and is accelerating
|
GO TOP
|
|
|
HOW THE CLIMATE SYSTEM WORKS
An equilibrium has been established over thousands of years ... but recent changes could destabilize this fragile equilibrium
|
GO TOP
|
|
|
EFFECTS OF CLIMATE CHANGE
The impact of climate change has the potential to be catastophic
|
GO TOP
|
|
|
LIKELY CAUSES OF CLIMATE CHANGE
Most degradation of the environment comes from industrial activities.
Industrial activity is required in order to suuport people's consumption
|
GO TOP
|
|
|
ESSENTIAL RESPONSES TO CLIMATE CHANGE RISKS
|
GO TOP
|
|