THE SOCIO-ENVIRO-ECONOMIC SYSTEM
NATURAL CAPITAL / ENVIRONMENT
IN THE LONG RUN EVERYTHING DEPENDS ON A SUSTAINABLE ENVIRONMENT
|
|
NAVIGATION within NATURAL CAPITAL (ENVIRONMENT)
|
SUN

|
LAND

|
WATER

|
AIR

|
RESOURCES

|
BIODIVERSITY

|
ECOSYSTEMS

|
|
SUN
|
|
|

|
The sun is the source of ALL the energy that is available on planet earth. Energy from the sun is stored in fossil fuel deposits that have accumulated for millions of years, and more solar energy reaches earth every day!
|
|
LAND
|
|
|
|
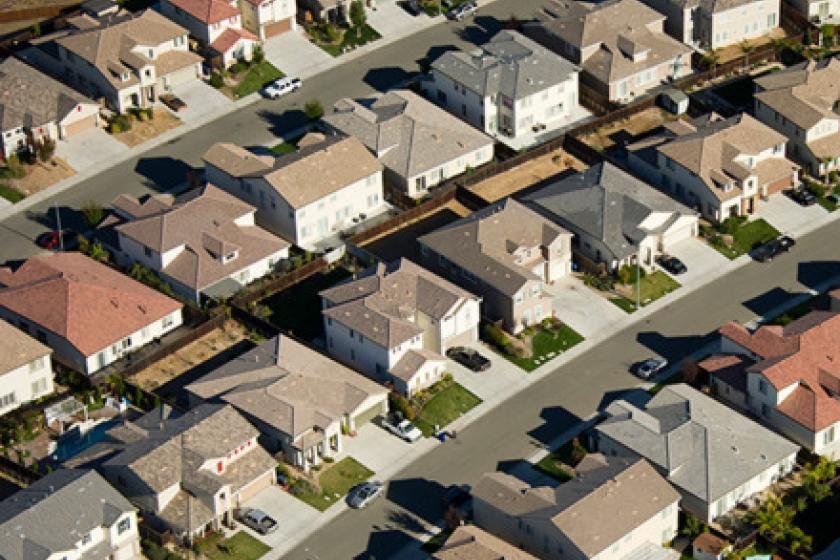
There is a limited amount of land on the planet. Land is one of the key planetary limits. It is vital that land is used in a sustainable manner rather than being degraded in the interest of unsustainable economic performance.
|
|
WATER
|
|

|
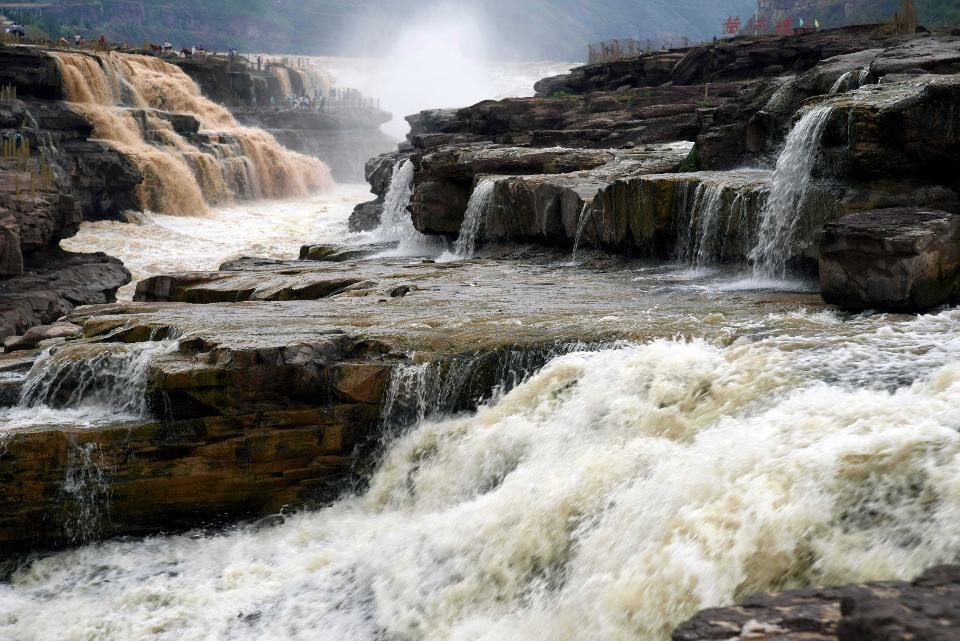
Without water, life as we know it cannot exist. In conventional economics, water is undervalued because for a big part of history it has been abundant and easily accessed. This is changing and water must now be valued more appropriately.
|
|
AIR
|
|
|
|
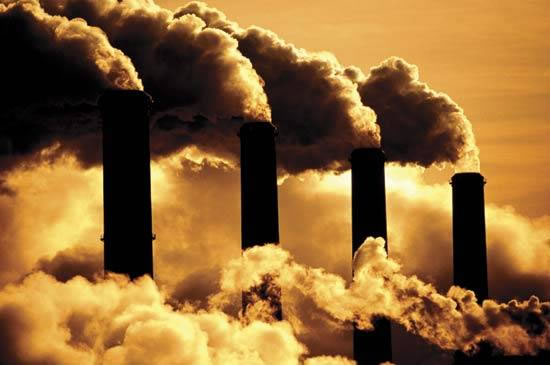
Clean air is good for human health as well as fauna and flora. Many steps have been taken to reduce the problem of air pollution that we can see, but not enough for the air pollution like CO2 that we cannot see, yet still dangerous.
|
|
RESOURCES
|
|
|

|
Natural resources have helped power the industrial revolution and enabled massive improvements in quality of life, but there are limits because of both depletion and egradation of natural capital. Better use of resources is essential.
|
|
BIODIVERSITY
|

|

|
Biodiversity is important. Humankind has emerged over millions of years as a result of massive biodiversity and complex evolution. The future of life depends on the continuing health of the biosphere in all its manifestations.
|
|
ECOSYSTEMS
|

|
|
There is genius in the way ecosystems have evolved over millions of years to stabilize natural systems in a way that has enabled life as we know it. We should be concerned that in the past 200 years this stability is being compromised.
|
- Nature is the source of ALL value
- To improve quality of life, nature has been exploited, depleted and degraded.
- Nature is rapidly degrading but ignored in conventional financial and economic analysis.
- This is NOT sustainable.
|
|
|
|
Navigation
|
|
|
NATURAL CAPITAL / ENVIRONMENT
NATURAL RESOURCES, ESSENTIAL BIO-SYSTEMS, AND A WHOLE LOT MORE
|
|
|
|
Natural Capital (NC)
The utterly amazing foundation for everything ... that is EVERYTHING
|
Open L0700-CS-NC-NATURAL-CAPITAL
|
|
|
ECONOMY / CREATED CAPITAL
Buildings, Infrastructure, Equipment, Vehicles, etc.
|
Open L070-SEES-ECONOMIC
|
|
|
Physical Capital (PC)
Buildings, Infrastructure, Equipment, Vehicles, etc.
|
Open L0700-CS-PC-PHYSICAL-CAPITAL
|
|
|
Financial Capital (FC)
Corporate Net Present Value, Capital Market Value , Financial Wealth
|
Open L0700-CS-FC-FINANCIAL-CAPITAL
|
|
|
Knowledge Capital (KC)
Scientific Knowledge
|
Open L0700-CS-KC-KNOWLEDGE-CAPITAL
|
|
|
Institutional Capital (IC)
Scientific Knowledge, Governance, Justice, Rule of Law, Organization and Management
|
Open L0700-CS-IC-INSTITUTIONAL-CAPITAL
|
|
|
Cultural Capital (CC)
Scientific Knowledge, Governance, Justice, Rule of Law, Organization and Management
|
Open L0700-CS-CC-CULTURAL-CAPITAL
|
|
|
Locational Capital (CC)
Place ... where everything comes together into a coherent whole ... or not
|
Open L0700-CS-LC-LOCATIONAL-CAPITAL
|
|
|
NATURAL CAPITAL
NATURAL RESOURCES, ESSENTIAL BIO-SYSTEMS, NATURAL EQUILIBRIUM CONTROL AND A WHOLE LOT MORE
|
|
Planet Earth / Water / Trees / Climate instability / Resource depletion /


|

|
Planet Earth / Water / Trees / Climate instability / Resource depletion
|
EVERYTHING IS ENABLED BY AND CONSTRAINED BY NATURE. ... In modern times, all sorts of People Built Systems (PBS) have been created to convert natural capital into financial capital. Over the past 200 years there have been enormous changes in the technology available to create financial capital, and people have used increasingly sophisticated management metrics to optimize for profit performance and financial wealth creation. At the same time, the impact of human activities that create financial wealth on nature and all its natural systems have been ignored.
NATURAL SYSTEMS ... NATURAL CYCLES, ECOSYSTEM SERVICES, CLIMATE SYSTEMS
BIO-DIVERSITY / NATURE'S RESILIENCE ... FAUNA AND FLORA ... MILLIONS OF SPECIES ... MANY UNKNOWN
LAND ... USED FOR BIO SERVICES, HABITAT, AGRICULTURE, FORESTRY, BUILDING DEVELOPMENT, ETC.
WATER ... USED FOR HUMAN CONSUMPTION, INDUSTRY, AGRICULTURE AND NATURAL SYSTEMS
AIR ... ESSENTIAL FOR LIFE SUPPORT, BUT BEING USED AS A DUMP FOR GASEOUS WASTES
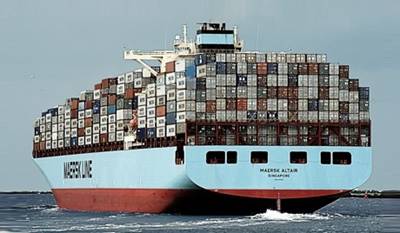
NATURAL RESOURCES / ENERGY
FOSSIL FUELS, FUELWOOD, WIND AND SOLAR
NATURAL RESOURCES / MINERALS / RAW MATERIALS
MINERALS, TIMBER, BIO-DIVERSITY
|
|
|
|
L0700-NC-NATURAL-CAPITAL
L0700-NC-NATURAL-CAPITAL ... NATURAL CAPITAL
There are many components to natural capital.
Everything has been made possible because there is Natural Capital ... but it is not infinite and has been seriously depleted since the 1700s.
There is the sun. There is life … whether this is human life or all the other life forms from single cell organisms to all sorts of fish and animals and to plants in all their varieties.
There are minerals and there are fossil fuels that represent millions if not billions of years of sun energy capture.
There is land and water and atmosphere.
There are ecosystems and biodiversity.
Nature works in many mysterious ways that we know little or nothing about, but are essential to the good health of people and the planet.
We now know something about the important services that the natural world provides which enable a natural environment in which animals, including humans can thrive. We do damage to natural capital at our peril. Despite this, there is no accounting for the impact economic activity has on natural capital. This has to change.
|
|
|
|
L0700-CS-NC-NATURAL CAPITAL
L0700-NC-AIR ... AIR
Air is essential for human life, but air pollution has been one of the unintended consequences of progress towards a better quality of life and standard of living, and may now be one of the biggest risks mankind has ever faced.
|
Open L0700-CS-NC-NATURAL CAPITAL
|

|
L0700-NC-CLIMATE
L0700-NC-CLIMATE ... CLIMATE
CLIMATE ... a natural system that is essential to the natural equilibrium of planet earth. The equilibrium has changed slowly over the past millions of years but change is now happening faster than at any time in history ... that is geological history. Scientists know a lot about what has happened in the past and know that this rapid change is happening. They do not know exactly where a new equilibriun will be established as a result of changes that have been happening as a result of human activity during the past few centuries.
|
Open L0700-NC-CLIMATE
|
|
|
L0700-NC-ECOSYSTEM-SERVICES
L0700-NC-ECOSYSTEM-SERVICES
|
Open L0700-NC-ECOSYSTEM-SERVICES
|

|
L0700-NC-FOSSIL-FUELS
L0700-NC-FOSSIL-FUELS
|
Open L0700-NC-FOSSIL-FUELS
|
|
L0700-NC-LAND
Much of the land on planet earth is either desert or mountain and unsuited to human habitation. Some people in the modern consumer economy are using more than their fair share of the land to support their lifestyle. Land is being developed into urban conurbations and for industrial scale agriculture reducing the land that is available for natural ecosystem services critical for the sustainability of the enviro-socio-economic system.
|
Open L0700-NC-LAND
|

|
L0700-NC-NATURES-LIVING-SYSTEMS
L0700-NC-NATURES-LIVING-SYSTEMS
|
Open L0700-NC-NATURES-LIVING-SYSTEMS
|
|
|
L0700-NC-MINERALS
L0700-NC-MINERALS
|
Open L0700-NC-MINERALS
|
|
|
PLANET
PLANET is like a PLACE ... only bigger, and much more difficult to comprehend. PLANET is also a shorthand for Natural Capital and all the bounty provided by nature, and the power that comes from the sun and taken for granted.
|
|
|
|
SUN ... SOURCE OF ALL ENERGY
The sun is the source of all the energy that is available on the earth. The natural systems that convert the energy of the sun into other forms of energy that endure through time are critical for the sustainability of the planet, but poorly understood both in science and more dangerously by policy makers.
| Open L0700-NC-SUN
|

|
L0700-NC-WATER
L0700-NC-WATER ... WATER
There is more water than land on planet earth, but only a small part of the water is potable freshwater. Most is saline in the oceans. Water is vital to life. A human will die after three days without any hydration and freshwater is increasingly scarce.
|
Open L0700-NC-WATER
|
|
|
L0700-NC-Australia
L0700-NC-Australia ... about Environmental Accounting for the Nation of Australia
Australia has been at the forefront of national level statistics and government financial management for several decades ... and it comes at no surprise that they are doing significant work in the area of environmental accounting. I am struck by the high environmental value that is placed on energy resources, which I believe is a result of valuing resources using money as a single composite unit of account. Timber has virtually no value, while fossil based energy resources have a very high valuation.
|
Open L0700-NC-Australia
|


|
|
NATURE'S LIVING SYSTEMS
The living systems of nature ... including human beings ... are extremely complex and quite amazing. Despite the amazing growth in knowledge during the last century very little is known about the deep intricacies of these natural living systems. What is now known is that they are immensely important for sustaining the enviro-socio-economic system that is key to quality of life and standard of living.
| Open L0700-NC-NATURES-LIVING-SYSTEMS
|
|
|
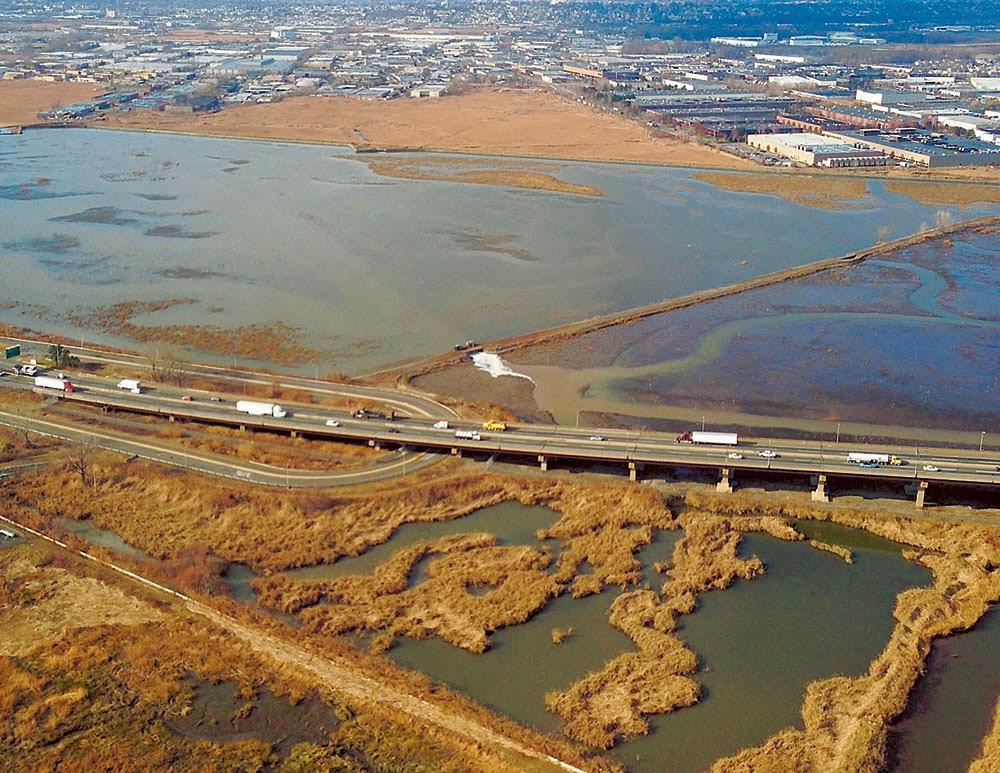
RESOURCE DEPLETION, ENVIRONMENTAL DEGRADATION AND ECOSYSTEM REMEDIATION
NATURAL CAPITAL has been diminished significantly since the beginning of the modern era ... since the start of the agricultural revolution and then the industrial revolution. There has been resource depletion and environmental degradation that has not been taken into account in the metrics of socio-economic performance and no credit given for ecosystem remediation, an activity now growing, but long overdue. Resource Depletion and Environmental Degradation is a shorthand way of embracing everything that relates to loss of Natural Capital. When some of nature's bounty is consumed in a manner that means it can never be recovered, there is resource depletion. When the environment is damaged in some way, and there is some possibility that there might be some future recovery, this is environmental degradation. Both are stresses on the planet, that imply risk for the future.
| Open L0700-NC-CLIMATE
|
|
|
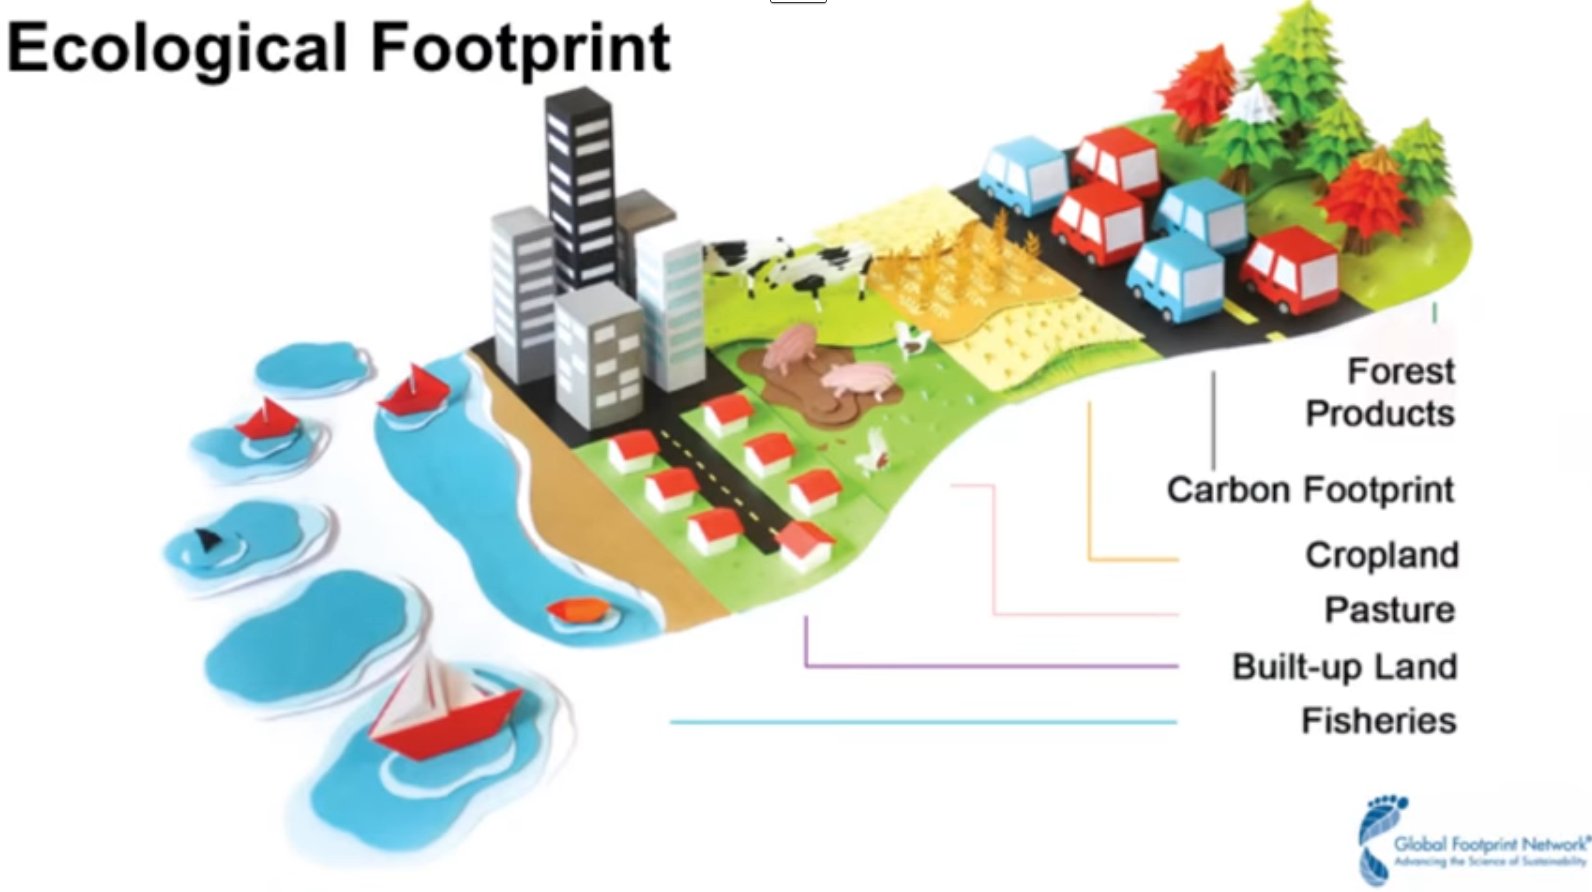
Ecological Footprint
| |
|
|
Measurements for Natural Capital
The goal must be to have a single number that represents the totality of the impact a reporting entity is having on all components of Natural Capital and another number that reflects the contrinution the reporting entity is having on all components of Human Capital. Performance is a measure derived from these two numbers.
|
|
|
|
|
Water
It makes no sense that water is taken for free in so many settings. Water is one of the most valuable substances on the planet and MDIA quantification should reflect this. The MDIA standard value should reflect changes in water abundance that exist from place to place. Too little water and there are problems. Too much water and there are problems.
|
|
|
|
|
NC-Water-001-150102 .... Peter Burgess DRAFT
'http://truevaluemetrics.org/DBpdfs/NaturalCapital/Water/NC-Water-001-150102.pdf'
| Open PDF ...
NC-Water-001-150102
|
|
|
|
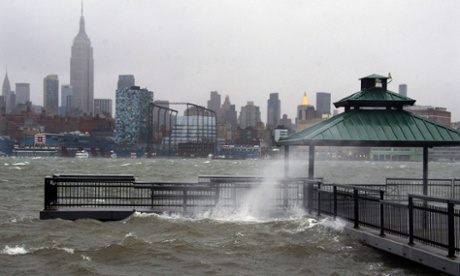
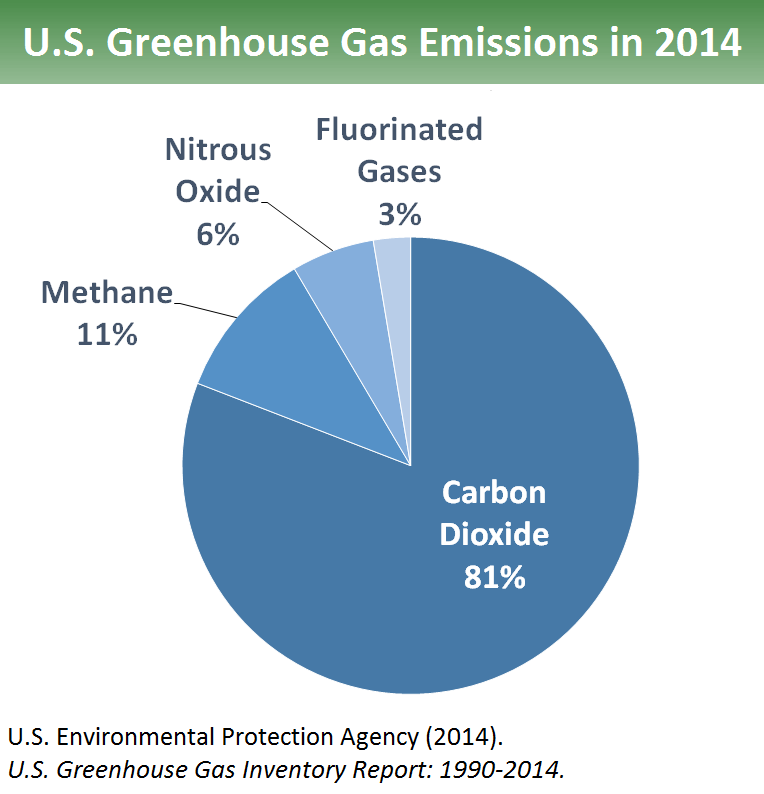
Green House Gas (GHG) Emissions
The scientific community has concluded that green house gas (GHG) emissions are in the process of changing the world's climate. This is sometimes referred to as global warming, but the changes are likely to be quite unpredictable as climate systems change significantly. For example, a change in the Gulf Stream that warms Europe could result in a Europe that becomes significntly colder than it now is. Carbon Dioxide emissions (CO2e) are the highest volume of GHGs, but methane emissions (CH4e) are more potent than CO2e by a factor of more than 20.
Almost every human activity, especially those involving the consumption of energy, produce GHGs. The people of the USA and Canada are among the highest per capita producers of GHGs.
|
|
|
|
|
TVM-MDIA-About-Carbon-131111a
'http://www.truevaluemetrics.org/DBpdfs/BMABusiness/TVM-MDIA/TVM-MDIA-About-Carbon-131111a.pdf'
|
| Open PDF ...
TVM-MDIA-About-Carbon-131111a
|
|
|
Methane ... Role of ruminant animals in the production of methane
Estimation of the methane production related to ruminant animal digestion
'http://www.truevaluemetrics.org/DBpdfs/GHGs/Methane/Role-of-Ruminant-Animals.pdf'
|
| Open PDF ...
Role-of-Ruminant-Animals
|
|
|
EPA ... estimating emissions from different types of soils
'http://www.truevaluemetrics.org/DBpdfs/GHGs/EPA-c14s01.pdf'
|
| Open PDF ...
Emissions by soil type
|
|
There are a mix of
|
|
|
|
The total US GHG emissions for the USA are around 5 million metric kilo-tons CO2 equivalent per year ... for a population of around 320 million people.
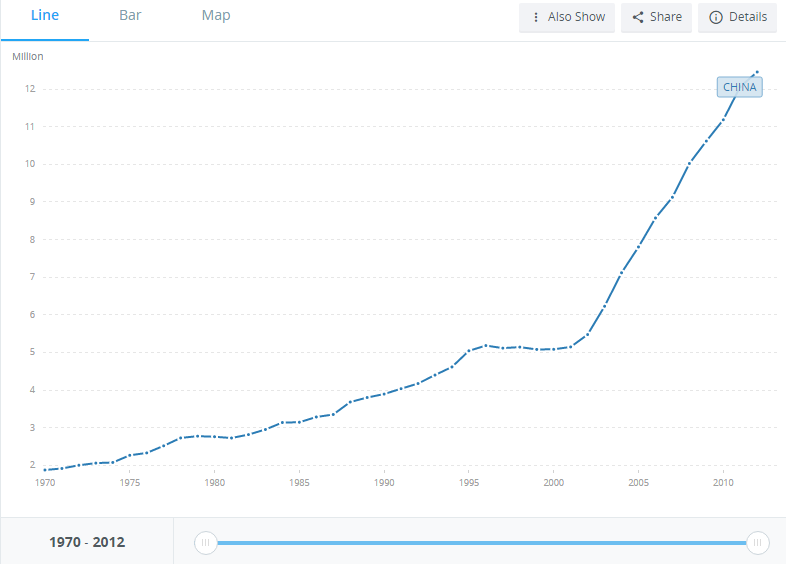
Total emissions for China exceed 12 million metric kilo-tons CO2 equivalent per year ... for a population of more than 1.3 billion people ... up from less than 3 million metric kilo-tons CO2 equivalent in 1980
The per capita emissions of CO2 equivalent in the USA is in excess of 15 metric tons compared to China which is around 9 metric tons, up from less than 3 in the early 80s.
|
|
|
|
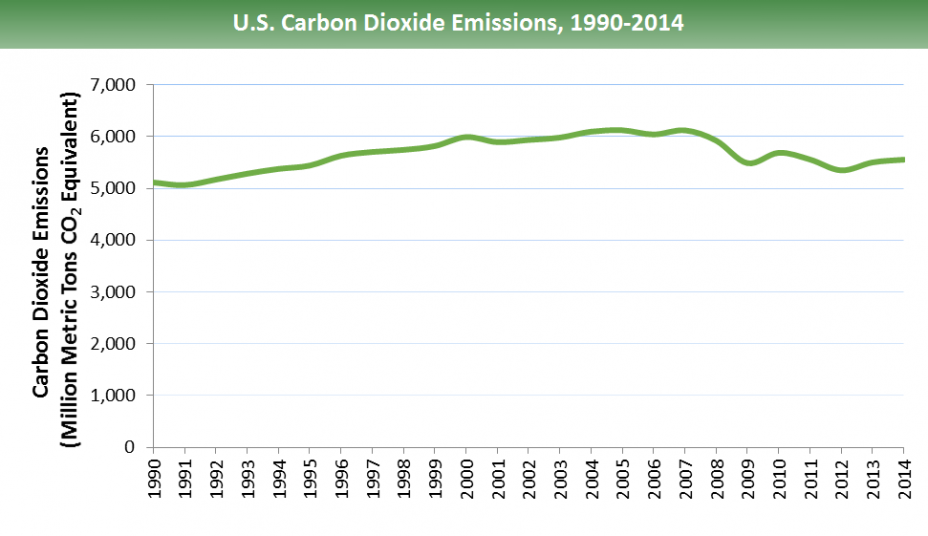
CO2 emissions (kt)
|

|
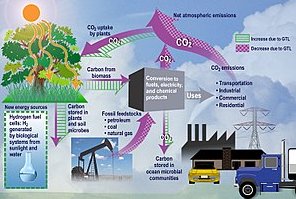
Carbon dioxide emissions are those stemming from the burning of fossil fuels and the manufacture of cement. They include carbon dioxide produced during consumption of solid, liquid, and gas fuels and gas flaring.
Aggregation Method: Gap-filled total
Development Relevance: Carbon dioxide (CO2) is naturally occurring gas fixed by photosynthesis into organic matter. A byproduct of fossil fuel combustion and biomass burning, it is also emitted from land use changes and other industrial processes. It is the principal anthropogenic greenhouse gas that affects the Earth's radiative balance. It is the reference gas against which other greenhouse gases are measured, thus having a Global Warming Potential of 1. Burning of carbon-based fuels since the industrial revolution has rapidly increased concentrations of atmospheric carbon dioxide, increasing the rate of global warming and causing anthropogenic climate change. It is also a major source of ocean acidification since it dissolves in water to form carbonic acid. The addition of man-made greenhouse gases to the Atmosphere disturbs the earth's radiative balance. This is leading to an increase in the earth's surface temperature and to related effects on climate, sea level rise and world agriculture. Emissions of CO2 are from burning oil, coal and gas for energy use, burning wood and waste materials, and from industrial processes such as cement production. Emission intensity is the average emission rate of a given pollutant from a given source relative to the intensity of a specific activity. Emission intensities are also used to compare the environmental impact of different fuels or activities. The related terms - emission factor and carbon intensity - are often used interchangeably. The carbon dioxide emissions of a country are only an indicator of one greenhouse gas. For a more complete idea of how a country influences climate change, gases such as methane and nitrous oxide should be taken into account. This is particularly important in agricultural economies. The environmental effects of carbon dioxide are of significant interest. Carbon dioxide (CO2) makes up the largest share of the greenhouse gases contributing to global warming and climate change. Converting all other greenhouse gases (methane (CH4), nitrous oxide (N2O), hydrofluorocarbons (HFCs), perfluorocarbons (PFCs), sulphur hexafluoride (SF6)) to carbon dioxide (or CO2) equivalents makes it possible to compare them and to determine their individual and total contributions to global warming. The Kyoto Protocol, an environmental agreement adopted in 1997 by many of the parties to the United Nations Framework Convention on Climate Change (UNFCCC), is working towards curbing CO2 emissions globally.
Limitations and Exceptions: The U.S. Department of Energy's Carbon Dioxide Information Analysis Center (CDIAC) calculates annual anthropogenic emissions from data on fossil fuel consumption (from the United Nations Statistics Division's World Energy Data Set) and world cement manufacturing (from the U.S. Department of Interior's Geological Survey, USGS 2011). Although estimates of global carbon dioxide emissions are probably accurate within 10 percent (as calculated from global average fuel chemistry and use), country estimates may have larger error bounds. Trends estimated from a consistent time series tend to be more accurate than individual values. Each year the CDIAC recalculates the entire time series since 1949, incorporating recent findings and corrections. Estimates exclude fuels supplied to ships and aircraft in international transport because of the difficulty of apportioning the fuels among benefiting countries.
Periodicity: Annual
Statistical Concept and Methodology: Carbon dioxide emissions, largely by-products of energy production and use, account for the largest share of greenhouse gases, which are associated with global warming. Anthropogenic carbon dioxide emissions result primarily from fossil fuel combustion and cement manufacturing. In combustion different fossil fuels release different amounts of carbon dioxide for the same level of energy use: oil releases about 50 percent more carbon dioxide than natural gas, and coal releases about twice as much. Cement manufacturing releases about half a metric ton of carbon dioxide for each metric ton of cement produced. Data for carbon dioxide emissions include gases from the burning of fossil fuels and cement manufacture, but excludes emissions from land use such as deforestation. The unit of measurement is kt (kiloton). Carbon dioxide emissions are often calculated and reported as elemental carbon. The were converted to actual carbon dioxide mass by multiplying them by 3.667 (the ratio of the mass of carbon to that of carbon dioxide).
Source: Carbon Dioxide Information Analysis Center, Environmental Sciences Division, Oak Ridge National Laboratory, Tennessee, United States.
License Open
|
|
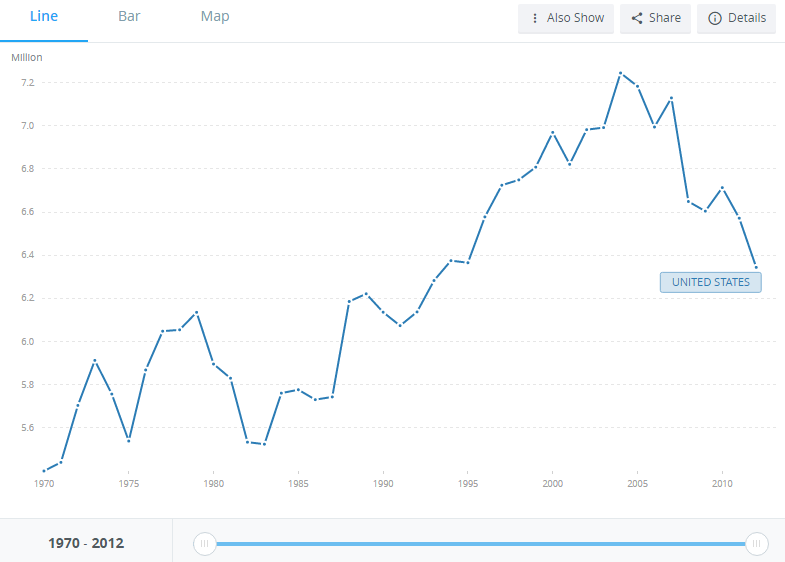
USA total greenhouse gas emissions (kt of CO2 equivalent)1970 - 2012
|
 Go to World Bank data
|
Annual total US emission of GHGs was around 7.2 million metric kilotons CO2 equivalent in 1984. In 2012 it was estimated to be under 6.4 million metric kilotons CO2 equivelent. In the period 1970 to 1985 total US emissions averaged around 5.8 million metric kilotons CO2 equivalent.
The amount of GHG emissions in the USA has a strong correlation with GDP and consumption. In the 1970s as a result of the global oil shock, economic growth in the USA was disrupted, especially for energy intensive industries, like for example, cement and steel. Economic growth in the 1980s and aggregate US emissions increased and then reduced as GDP and consumption and related production stalled.
With a population of around 320 million people, 6.4 million kilotons is equivalent to a per capita CO2 equivelent emission of 20 metric tons per person.
Source: European Commission, Joint Research Centre ( JRC )/Netherlands Environmental Assessment Agency ( PBL ). Emission Database for Global Atmospheric Research ( EDGAR ), EDGARv4.2 FT2012: edgar.jrc.ec.europa.eu
Note the difference in the y-axis between the USA graphic and the China graphic.
|
|
China total greenhouse gas emissions (kt of CO2 equivalent) 1970 to 2012
|
 Go to World Bank data
|
In 1970 the total GHG emissions were under 2 million metric kilotons CO2 equivalent. By 2012 this had risen to more than 12 million metric kilotons. As in the USA the total emissions has a strong correlation with the level of economic activity which has also grown rapidly in the same period.
With a population of 1.35 billion in 2012, and 12 million metric kilotons CO2 equivalent of emissions in total, the per capita emission computes to 8.9 metric tons CO2 equivalent per capita. The reported CO2 equivalent metric tons is 7.5 metric tons CO2 equivalent per capita. It is not obvious why these numbers are not somewhat closer.
Source: European Commission, Joint Research Centre ( JRC )/Netherlands Environmental Assessment Agency ( PBL ). Emission Database for Global Atmospheric Research ( EDGAR ), EDGARv4.2 FT2012: edgar.jrc.ec.europa.eu
|
|
China compared to the USA
The key takeaway from the comparison between USA and China is that the efficiency of the USA economy taking emissions into consideration is very low. Yhere is a huge potential to use modern technology and engineering to improve this efficiency.
|
|
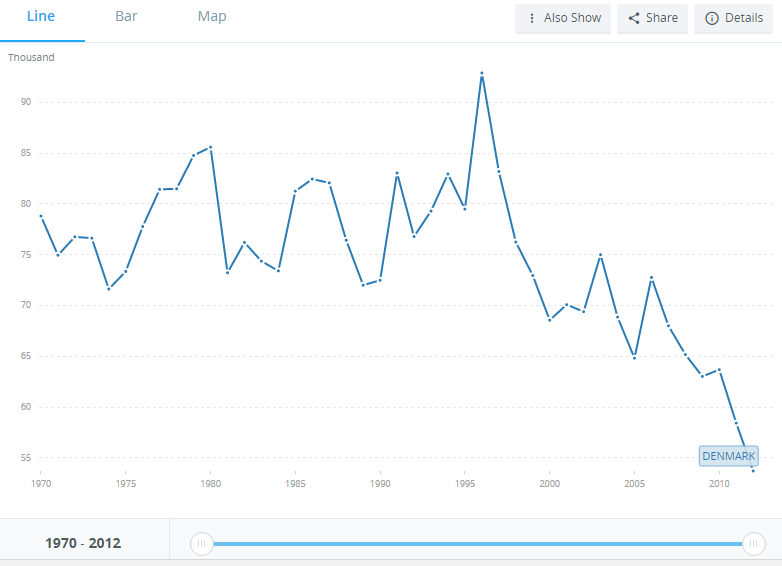
Denmark total greenhouse gas emissions (kt of CO2 equivalent) 1970 to 2012
|
 Go to World Bank data
|
From 1970 to 1990 there was a small upward trend in the total GHG emissions for the country. Since 1990 to 2012 there has been a substantial reduction in the total GHG emissions ... a reduction to a level that is about 50% of the 1970 to 1990 average emissions.
Source: European Commission, Joint Research Centre ( JRC )/Netherlands Environmental Assessment Agency ( PBL ). Emission Database for Global Atmospheric Research ( EDGAR ), EDGARv4.2 FT2012: edgar.jrc.ec.europa.eu
|
|
Denmark compared to the USA
A similar takeaway arises from the comparison between USA and Denmark. The USA economy may be profitable in a financial sense, but taking emissions into consideration, the efficiency is very low. There is a huge potential to use modern technology and engineering to improve this efficiency. This should be the biggest sector for employment growth over the next few decades.
|
|
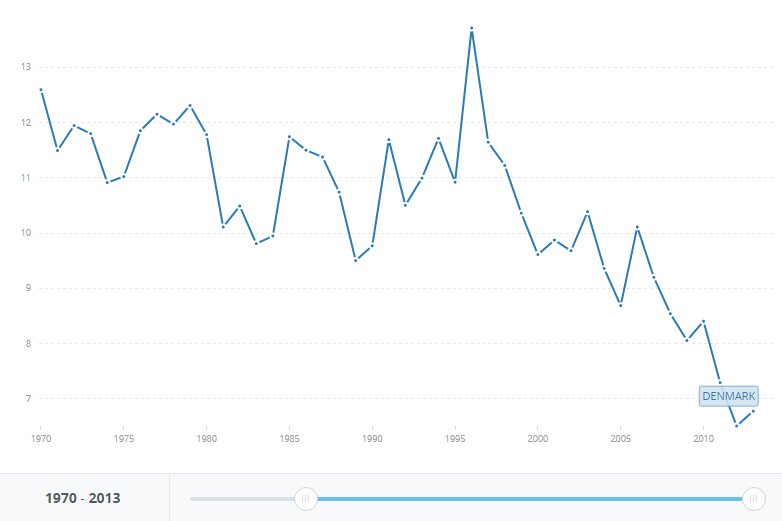
Denmark per capita CO2 emissions in metric tons CO2 per capita - 1970 to 2012
|
 Go to World Bank data
|
From 1970 to 1996 the per capita CO2 emissions was averaging around 11 tons per capita poer year. Since 1996 this has been dropping significantly and by 2012 had dropped below 7 tons per capita per year.
Source: European Commission, Joint Research Centre ( JRC )/Netherlands Environmental Assessment Agency ( PBL ). Emission Database for Global Atmospheric Research ( EDGAR ), EDGARv4.2 FT2012: edgar.jrc.ec.europa.eu
|
|
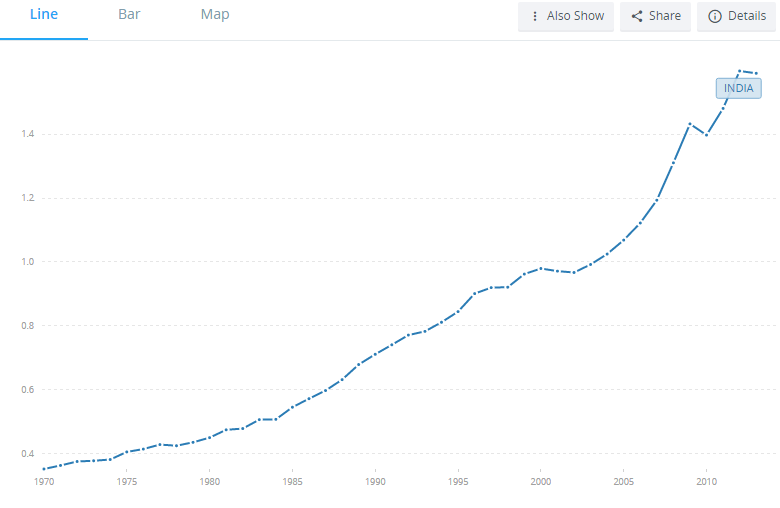
India CO2 emissions (metric tons per capita)... 1970 - 2012
|
 Go to World Bank data
|
There has been a very large increase in per capita CO2 emissions in India from 1970 to 2012. Per capita emissions in 2012 were calculated to be around 1.6 metric tons CO2 per capita. This compares with the US per capita CO2 emissions of 20 metric tons.
Source: Carbon Dioxide Information Analysis Center, Environmental Sciences Division, Oak Ridge National Laboratory, Tennessee, United States.
The population of India is around 1.1 billion. As the country modernises and increases its economic activity there will be a massive increase in the total GHG emissions from India. If the country embraces the US model for socio-enviro-economic development the total annual GHG emissions from India will increase by some 10 times. This would be catastrophic for climate stability, and for all practical purposes is being ignored by policy makers at the highest levels.
|
|
Natural Capital Committee ... UK
| |
State-of-Nature-2013
'http://truevaluemetrics.org/DBpdfs/NaturalCapital/State-of-Nature-2013.pdf'
| Open PDF ...
State-of-Nature-2013
|
NC-2012 ... The new BUSINESS IMPERATIVE: VALUING NATURAL CAPITAL
'http://truevaluemetrics.org/DBpdfs/NaturalCapital/NC-2012.pdf'
| Open PDF ...
NC-2012
|
Changes in the global value of ecosystem services
Robert Costanza a, *, Rudolf de Groot b , Paul Sutton c,d , Sander van der Ploeg b , Sharolyn J. Anderson d , Ida Kubiszewski a , Stephen Farber e , R. Kerry Turner f
In 1997, the global value of ecosystem services was estimated to average $33 trillion/yr in 1995
($46 trillion/yr in 2007 ). In this paper, we provide an updated estimate based on updated unit ecosystem service values and land use change estimates between 1997 and 2011. We also address some of the critiques of the 1997 paper. Using the same methods as in the 1997 paper but with updated data, the estimate for the total global ecosystem services in 2011 is $125 trillion/yr (assuming updated unit values and changes to biome areas) and $145 trillion/yr (assuming only unit values changed), both in 2007 . From this we estimated the loss of eco-services from 1997 to 2011 due to land use change at $4.3–20.2 trillion/yr, depending on which unit values are used. Global estimates expressed in monetary accounting units, such as this, are useful to highlight the magnitude of eco-services, but have no specific decision-making context. However, the underlying data and models can be applied at multiple scales to assess changes resulting from various scenarios and policies. We emphasize that valuation of eco-services (in whatever units) is not the same as commodification or privatization. Many eco-services are best considered public goods or common pool resources, so conventional markets are often not the best institutional frameworks to manage them. However, these services must be (and are being) valued, and we need new, common asset institutions to better take these values into account. 2014 Elsevier Ltd. All rights reserved.
'http://truevaluemetrics.org/DBpdfs/Environment/Global-Environmental-Change-Costanza-et-al-May-2014.pdf'
| Open PDF ...
Global-Environmental-Change-Costanza-et-al-May-2014
|
Environmental Accounting in Australia
Australia has been at the forefront of national level statistics and government financial management for several decades ... and it comes at no surprise that they are doing significant work in the area of environmental accounting. I am struck by the high environmental value that is placed on energy resources, which I believe is a result of valuing resources using money as a single composite unit of account. Timber has virtually no value, while fossil based energy resources have a very high valuation.
The information in this webpage has been downloaded from this Australian Government source: http://www.abs.gov.au/ausstats/abs@.nsf/mf/4655.0
|
Open file L0700-NC-Australia
|
Open external link
|

|
Ecosystem Services
The observed decline in species populations is inextricably linked to
the state of the ecosystems that sustain them. Destruction of these
ecosystems represents a risk not just to resident plants and wildlife,
but to humans as well. For ecosystems provide us with food, fresh
water, clean air, energy, medicine, and recreation. In addition, we
depend upon healthy and diverse natural systems for the regulation
and purification of water and air, climatic conditions, pollination and
seed dispersal, and control of pests and diseases (Figure 6).
The available stock of renewable and non-renewable natural
resources that supports human life (e.g., plants, animals, air, water,
soils, minerals) can be described as “natural capital”. Natural capital
delivers a flow of benefits to people both locally and globally. The
benefits themselves are often referred to as “ecosystem services”.
Natural capital assets evolved to be self-sustaining. But increased
human pressure – such as conversion of natural habitat to
agriculture, overexploitation of fisheries, pollution of freshwater
by industries, urbanization and unsustainable farming and fishing
practices – is diminishing natural capital at a faster rate than it can
be replenished. We are already experiencing the consequences of
natural capital depletion. These consequences are expected to grow
over time, increasing food and water insecurity, raising prices for
many commodities, and increasing competition for land and water.
Greater competition for natural capital will exacerbate conflict and
migration, climate change and vulnerability to natural disasters such
as flooding and drought. There will be a general decline in physical
and mental health and well-being and this will lead to more conflict
and migration.
Courtesy: Ecological Footprint Network
The True Value Accounting system integrates thinking about how ecosystem services interacts with People Built Systems and Structures that have been created at an ever increasing pace through the agricultural revolution, the industrial evolution and now the knowledge revolution to improve quality of life ... or not!
|
|
|
|
The Many Components of Ecosystem Services
|
|
Food
|
|
|
|
|
Raw materials
|
|
|
|
|
Medical resources
|
|
|
|
|
Fresh water
|
|
|
|
|
Mental and physical health
|
|
|
|
|
Recreation and ecotourism
|
|
|
|
|
Aesthetic values
|
|
|
|
|
Religious and spiritual values
|
|
|
|
|
Nutrient cycling
|
|
|
|
|
Photsynthesis
|
|
|
|
|
Soil formation
|
|
|
|
|
Air quality regulation
|
|
|
|
|
Climate regulation
|
|
|
|
|
Water regulation
|
|
|
|
|
Ecosystem regulation
|
|
|
|
|
Climate regulation
|
|
|
|
|
Water regulation
|
|
|
|
|
Ecosystem regulation
|
|
|
|
|
Water purification and waste treatment
|
|
|
|
|
Disease and pest regulation
|
|
|
|
|
Pollination
|
|
|
|
|
Moderation of extreme events
|
|
|
|
|
