SOCIO-ENVIRO-ECONOMIC SYSTEM
PROGRESS AND PERFORMANCE
SOCIETY
GDP and financial wealth have grown very rapidly ... but inequality means too many people are unhappy.
|
|
|
|
TO DO ... update images to be more relevant to the subject matter
|

|

|

|

|

|

|
OVERVIEW
The modern socio-enviro-economic system has delivered a massive increase in financial wealth, most of which has been for the benefit of very few. In aggregate the economy has performed well, butat the expense of society and a large part of the world's population is utterly disillusioned. In mature rich economies most of the wealth is at the 'top' with the middle class and below anticipating a lower standard of living rather than a better living standard. In developing economies starved for capital there are a myriad of problems and little idea of how these problems can be addressed.
In order for the system to be managed so that Society as a whole can progress, major changes in measurement are needed. With better metrics it is possible that some of the essential structural changes in the way the socio-enviro-economic system functions can be identified and implemented. Without apprpriate metrics, this will never happen.
|
|
|
GDP -v- GPI
Gross Domestic Products -v- Genuine Progress Indicator
|
GO TOP
|
GDP going up while GPI stays the same or declines

Until the late 1960s there was some correletion between per capita Gross Domestic Product (GDP) and the Genuine Progress Indicator (GPI), but this ended with the economic downturn of the early 1970s, the subsequent oil shock of 1973 and the associated stagflation and cost push inflation. After 1980, there was a new political imperative where deregulation and profit became the dominant policy rather than a more balanced set of socio-economic goals.
The cost push inflation of the 1970s was ended in large part by the expansion of offshore manufacturing espcecially in China and reduction of high wage US manufacturing.
TPB note: It is worth remembering that every $ of US money that is domiciled in China got there because the US private sector sent it there in order to bring low price (and even lower cost) Chinese products back to the USA so that they could sell them for a big profit in the United States.
TPB Note: Worse, when wages in the USA stagnated and aggregated demand stalled, the banking sector came to the rescue and enabled consumer finance so that the buying could continue, even though this would ruin the balance sheet of almost every family in the country!
|
|
|
|
Productivity and Profits UP -- > Wages Down
Massive redistribution of wealth from workers to owners!
|
GO TOP
|
Profits up ... Wages, not so much!
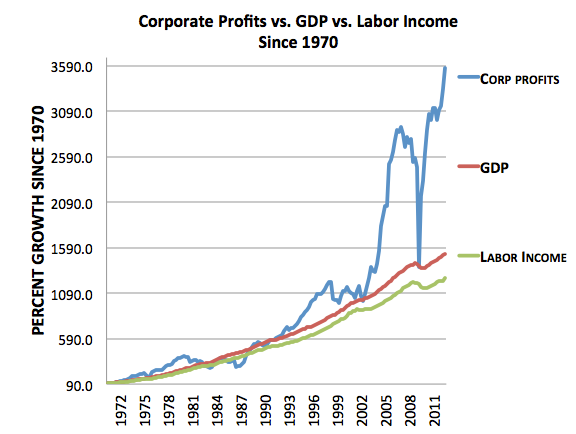
Profits were recovering faster than wages after the economic problems of the 1970s, until 2000 when profits dropped significanlty with the dot.com bust, but since then profits have grown explosively while wages have been stagnant. The structural changes in the underlying economic situation in the United States have been aggravated by politics and the unreal narrative that profit gowth is good the the economy which is good for wages.
|
|
Productivity up ... Wages down!
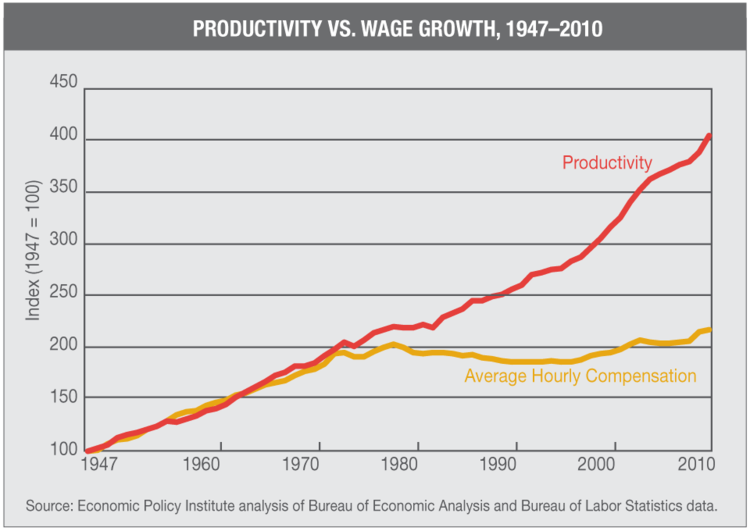
A plot of productivity versus wage growth shows that since the 1970s, NONE of the benefit of increased productivity has gone to improving wages ... ALL of it has gone to profits and to the benefit of owners.
TPB Note: It concerns me that eminent economists have talked about this problem for more than 40 years, and yet there has been almost no action by policy makers or anyone else in leadership positions to do something to solve the problem. My conclusion is that powerful people who understand management are really very happy with the prevailing outcomes and do not want to do damage to the 'golden goose' and most of the people who have concern for the issues of society and the environment don't know much about how management works, and especially management information. This is the underlying premise of the TVIA initiative!
|
|
Productivity up ... Wages down!

This graphic prepared by Secretary Reich in 2011 shows the same basic information ... that NONE of the benefit of increased productivity has gone to improving wages ... ALL of it has gone to profits and to the benefit of owners. For more than 30 years all the benefits of improved productivity has gone to owners, with none going to those that work.
In contrast, in the period 1945 to 1980 the growth of productivity was shared equitably between investors and workers.
|
|

|
|
Growth in GDP for the USA from 1995 to 2011

This set of data (from Andrew McAfee) shows a modest growth in GDP for the USA from 1995 to 2011. In this period corporate investment increased but dropped as the economy went into a short recession after the post Y2K tech boom and again in the so called 'great recession' of the period 2007/8/9.
Non financial profits after tax has grown stongly from 1995 to 205 but with signficiant fluctuations with big drops in the 2000 recession and again in the great recession a few years later. Total profits after tax did not fluctuate as much as the financial sector fluctuated less even though it had a huge role in the financial crisis that was responsible for the great recession.
None of these economic indicators suggests an economy and a society in trouble ... rather it looks like a set of trends that are really quite good.
|
|

The problem is that when the productivity / worker trends are added in (the red line) then it shows that the achievements of the economy are being obtained with less and less participation of workers. It comes as no surprise that a political candidate such as Donald Trump is able to attract votes based on a promise of change, when a very large proportion of the country's worklers are 'losing' relative to the more advantaged in the society.
This is very basic economic analysis that seems to have been ignorded by politicians, policy makers and the media for a very long time.
|
|
Inequality

Very high end apartments next to low income neighborhood in Brazil
| |
Inequality

More low income neighborhood in Brazil
|
|
Inequality . The Gini Index 1917 - 2011

There was massive inequality in the roaring 20s which was followed by the Great Depression of the 1930s.
Inequality was at its lowest level in the war years of the early 1940s and remained low until the 1980s when Reagan era deregulation and the weakening of unions became Republican public policy. By the time of the Great Recession and financial crisis of 2007/8/9 inequality as measured by the Gini index was almost as high as in the 1920s.
|
|
|
|
EMPLOYMENT / UNEMPLOYMENT TRENDS
|
GO TOP
|
Job loss and job creation 2007 to 2016 by month

Job losses resulting from the Bush era great recession and financial crisis during the period from around January 2008 to December 2009 peaked at some 800,000 a month. Month by month from January 2010 to the end of the Obama administration, job gains were in excess of 100,000 a month with around 20% of the months more than 200,000.
|
|
Unemployment rates 1980 to 2016 by month

Unemployment rates during the great recession and financial crisis of 2007/8/9 were higher than at any time since 1982 during the early Reagan administration.
There were significant increases in unemployment during the economic stress at the end of the Reagan era that required a reversal of policy by George H.W. Bush and then again another surge in unemployment at the end of the Clinton administation and the end of the dot.com bubble.
Unemployment at the end of the Obama administration is lower than at any time in the last 40 years
|
|
|
|
HOUSEHOLD BALANCE SHEET (US)
|
GO TOP
|
US Household Income -v- US Household Debt

In the period from 1972 to 2010 Household Income has declined by a modest amount, while Household Debt has increased substantially.
It should be noted that this is an aggregate result for the country. Individual families are likely to be better or worse than this average, and in the case of those that are in a worse position the present state of affairs means that many families are in dire financial straits
In this period of nearly 40 years the ratio of household credit to earnings has more than tripled.
The problem is aggravated by the change in demographics during this same period. The population is aging, and most older households in the United States are woefully unprepared financial for their old age.
|
|
Working age adults in the US population

The growth in the working age (24-60) population in the 1980s exceeded 1.5%, but has declined significanly since then.
In 2015 the growth of this population was around 0.5%.
The growth of population is one of the components of GDP growth ... and especially the growth of the working age population. Many mature economies including the United States have aging populations which are also associated with significantly lower consumption.
|
|
|
|
MONEY ... THE DECLINING DOLLAR
|
GO TOP
|
The declining value of the dollar

Some economists attribute the decline in value of the dollar to the creation of the Federal Reserve Bank.
It is possible to ascribe correlation to this, but not causation.
|
|
The declining value of the dollar

More likely is that the decline in the value of the dollar is attrributable to the changes that have ossurred in the underlying economy of the United States and the World.
There have been substantial drops in the value of the dollar during the First World War and the Second World War. In both cases there was massive 'inflation' caused by excessive demand for war materials ... demand pull inflation and production profits.
Global production profits have continued to fuel demand pull inflation since the 1980s. During the 1970s following the global 'oil shock', there was cost push inflation.
|
|
|
|
INTERNATIONAL DEVELOPMENT
|
GO TOP
|
Funding Development Assistance
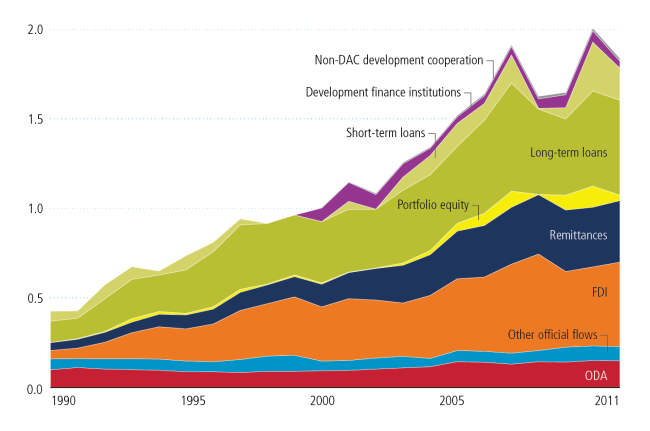
The changes in the structure of development financial flows over the past 40 years mean that developing countries are going to be less and less able to achieve independent sustainability. This outht to be a matter of great concern, but the discussion is muted.
Official Development Assistance (ODA) has remained at about the same level of several decades.
However, various forms of debt financing and foreign direct investment have increased substantially. The expectation with these modes of financing is that there will be a 'return' from these investments that is a risk adjusted market rate. In most cases this will be substantially more than the underlying increase in the productivity and performance of the economy ... and the basic arithmetic is that the country gets pooer rather than richer as a result of the financial interevention.
The good news is that international remittances have grown substantially. These fund flows have a very positive impact on the quality of life of the beneficiaries. Sadly remittances are also the target of politicians who have an interest in taxing these fund flows.
|
|
|
|
|
