INTERESTING IDEAS
PLANETARY BOUNDARIES
|
|
|
|
TO DO ... update images to be more relevant to the subject matter
|

|

|
|
|
Planetary Boundaries
Planetary boundaries is a concept of nine Earth system processes which have boundaries proposed 2009 by a group of Earth system and environmental scientists led by Johan Rockström from the Stockholm Resilience Centre and Will Steffen from the Australian National University. The group wanted to define a 'safe operating space for humanity' for the international community, including governments at all levels, international organizations, civil society, the scientific community and the private sector, as a precondition for sustainable development. The framework is based on scientific evidence that human actions since the Industrial Revolution have become the main driver of global environmental change. The scientists assert that once human activity has passed certain thresholds or tipping points, defined as 'planetary boundaries', there is a risk of 'irreversible and abrupt environmental change'.[3] The nine Earth system process boundaries mark the safe zone for the planet to the extent that they are not crossed. As of 2009, two boundaries have already been crossed, while others are in imminent danger of being crossed.[4]
https://en.wikipedia.org/wiki/Planetary_boundaries
|
Open external link
|
Doughnut Economics
This is an interesting variant on Planetary Boundaries developed by Kate Rayworth during her time with Oxfam
|
Open L0700-II-DOUGHNUT-ECONOMICS
|
TPB Observation
What would be very useful would be to have a version of planetary boundaries that works for each and every actor in the socio-enviro-economic system. Rich people everywhere in the world are responsible for most of the overshoot, while poor people subsidise the rich. Taken as a whole, the United States is totally unsustainable. There will be a global catastrophe if all the world becomes as rich and dangerously inefficient as the United States.
|
|
The segmentation of planetary boundaries in the above diagram is as follow:
(1) BIOSPHERE INTEGRITY
(1a) Functional Diversity
(1b) Genetic Diversity
(2) CLIMATE CHANGE
(3) NOVEL ENTITIES
(4) STRATOSPHERIC OZONE DEPLETION
(5) ATMOSPHERIC AEROSOL LOADING
(6) OCEAN ACIDIFICATION
(7) BIOCHEMICAL FLOWS
(7a) Phosphorous
(7b) Nitrogen
(8) FRESHWATER USE
(9) LAND SYSTEM CHANGES
|
|
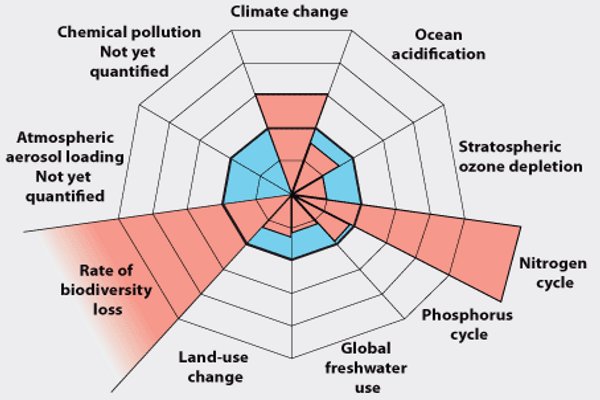
The segmentation of planetary boundaries in the above diagram is as follow (listed in order of decreasing concern :
(1) Nitrogen Flow
(2) Biodiversity Loss
(3) Climate Change
(4) Ocean Acidity
(5) Phosphorous Flows
(6) Agricultural Land Use
(7) Ozone Depletion
(8) Freshwater Consumption
(9) Atmospheric Aerosol Load
(10) Chemical Pollution
|
|
|
Downscaling Planetary Boundaries
|

|
2.1 Climate Change
The planetary boundary for climate change is generally expressed as a maximum concentration of CO2 in the atmosphere of 350 ppm, a value that would likely preserve the climate in a Holocene-like
state24. Atmospheric CO2 concentrations currently exceed 400 ppm25. Due to inertia in human energy systems, and in the Earth-system response to decarbonisation, it is generally regarded as unlikely that atmospheric CO2 can be brought below 350 ppm in the 21st century; even the most optimistic integrated assessment scenarios considered in the IPCC’s Fifth Assessment Report (AR5) only achieve a range of 420–440 ppm by 210026,27. To have an actionable target, it seems likely that a new (non-Holocene) climate state must be accepted—one that avoids the worst impacts of a changing climate, but allows for a reasonable chance for societies to decarbonise. How to set such a target has been one of the defining discourses in climate research and international policy28
.
As an alternative boundary to 350 ppm, we use the 2 oC temperature stabilisation goal emphasised in the Paris Agreement29. The cumulative emissions from 2011 to 2100 associated with a “high” probability (66%) of achieving this goal are approximately 1000 Gt CO2, or given a population of 7 billion people, approximately 1.61 t CO2 per capita (assuming CO2 emissions available in the 2011–2100 carbon budget are distributed uniformly over time). A number of factors could increase, or decrease, this number. For instance, a large uptake of negative emissions technologies might increase the overall budget, and thus the per capita allowances, but such technologies come with inherent biophysical, technological, and economic risks30,31. Conversely, the per capita boundary might be reduced by an increase in population, the absence of stringent mitigation after 2011, the (probable) absence of mitigation before 2020, or a shift in political ambition (e.g. towards the 1.5 oC target). Accordingly, 1.61 t CO2 per capita is likely to be a conservative estimate.
To estimate national performance in relation to this per capita boundary, CO2 emissions data were obtained from the Eora multi-region input-output (MRIO) database (http://worldmrio.com) 32,33.
These data represent the consumption-based allocation of CO2 emissions from energy production (excluding biomass burning) and cement production, where emissions embodied in imports and exports are added or subtracted, respectively, from national accounts.
|
2.2 Biogeochemical Flows
The planetary boundaries framework provides two sub-boundaries for biogeochemical flows, one for
the phosphorus cycle and the other for the nitrogen cycle. The planetary boundary for phosphorus is
6.2 Tg P y-1 mined and applied to erodible (agricultural) soils24, which we divided by world population
to arrive at a per capita boundary of 0.89 kg P y-1. National phosphorus footprint data were obtained
from the Eora MRIO database32,33, and represent the consumption-based allocation of phosphorus
fertilizer applied to cropland. The underlying phosphorus fertilizer data were compiled by Potter et
al.34, and are available from the NASA Socioeconomic Data and Applications Center (SEDAC)35. The
phosphorus data are based on estimates of harvested area for the period 1997–2003 and fertilizer
application rates for the period 1994–2001.
To account for the difference in time periods between the phosphorus data (ca. 2000) and the year
considered in this study (ca. 2011), the phosphorus data were scaled to match current global
phosphorus use (14.2 Tg P y-1) as reported by Steffen et al.24 For example, global phosphorus use is
10.0 Tg P y-1 according to the Eora database, which is lower than the estimate by Steffen et al. Thus
country values were multiplied by a factor of 14.2/10.0 to account for the difference in time period
and calculation methodologies. The adjusted Eora data were compared to phosphorus footprint
data from a more recent study by Metson et al.36. The two data sources yielded similar results, and
so we have used the Eora data in order to apply a consistent approach to international trade
The planetary boundary for nitrogen is 62 Tg N y-1 from industrial and intentional biological fixation24
, which we divided by world population to arrive at a per capita boundary of 8.9 kg N y-1. National
nitrogen footprint data were obtained from the Eora MRIO database32,33, and represent the
consumption-based allocation of nitrogen fertilizer applied to cropland. The underlying nitrogen
fertilizer data were compiled by Potter et al.34 in the same way as the phosphorus data, and are
available from SEDAC37. Similar to phosphorus, the nitrogen data were scaled to match current
global nitrogen fixation (150 Tg N y-1) as reported by Steffen et al.24
|
2.3 Freshwater Use
The original planetary boundary for freshwater use was specified as a maximum global withdrawal of
4000 km3
y-1 of blue water from rivers, lakes, reservoirs, and renewable groundwater stores38. This
boundary has been debated, both in terms of the level at which it is set39, and also in terms of its
relevance and scientific rigour, given that the environmental impacts of freshwater use are primarily
confined to the river-basin scale40
.
With the recent update to the planetary boundaries framework24, the global boundary remains the
same as originally proposed, but it has been complemented with a basin-scale boundary in
recognition of the heterogeneity in hydrological characteristics of river basins around the world41
.
The proposed basin-scale boundary draws on the concept of minimum “environmental flow
requirements” to maintain healthy riparian/coastal ecosystems and also takes into account seasonal
variation in freshwater availability by tracking monthly flows42. We believe it is important to take
into account the spatial and temporal variation in freshwater availability, but we are unaware of any
monthly, basin-scale data that also account for international trade of water-intensive products (i.e.
virtual water flows).
Due to the above data limitation, we explored two additional methods to attribute per capita
freshwater boundaries to nations (alongside the global boundary currently estimated in the
planetary boundaries framework). The first method extended a monthly basin-scale measure that
we had previously applied to Canada and Spain5
to nearly 150 countries using data from Hoekstra et
al.43, but the resulting territorial indicator was not consistent with our consumption-based analysis.
The second method was a bottom–up approach that upscaled basin-level environmental flow
requirements to a global aggregate of 2800 km3
per year39, which is notably less than the global
boundary in the planetary boundaries framework. However, this upscaling method also yielded a
smaller estimate of global freshwater consumption (1700–2270 km3
y-1) compared to the top–down
estimate of 2600 km3
y-1 from Steffen et al.24 As a result, the estimate from the planetary boundaries
framework that humanity is currently consuming 65% of the global freshwater boundary is fairly
similar to the central estimate of 71% using the bottom–up approach (and within the uncertainty
range of 61–81%).
Based on the above comparison of methods, we decided that the global boundary of 4000 km3
y-1
from the planetary boundaries framework was the most appropriate for our purposes, although we
note that the literature is still evolving. We divided this boundary by world population to arrive at a
per capita boundary of 574 m3
y-1. National water use data were obtained from the Water Footprint
Network44, and are an average for the period 1996–2005 (the most recent period available). The
data measure the consumption and pollution of blue water related to the domestic water supply,
plus virtual-water imports, minus virtual-water exports (and are thus a measure of apparent
consumption). Similar to the data for biogeochemical flows, the blue water data were scaled to
match current global freshwater use (2600 km3
y-1) as reported by Steffen et al.24
|
2.4 Land-System Change
The original planetary boundaries framework38 proposed the percentage of global land cover
converted to cropland as a measure of change in land use, and proposed a boundary of a maximum
of 15% of ice-free land being used for crops. Globally this translates into 1995 Mha, or about 0.3 ha
per capita45. With the recent update to the planetary boundaries work24, the land-system change
boundary is now defined in terms of the amount of forest cover remaining. The boundary is set
differently depending on forest biome, but works out to maintaining a minimum of 75% of global
original forest cover. Although in principle it would be possible to estimate a per capita boundary
associated with global forest cover, and a comparable national indicator, we take a different
approach here for two reasons: (i) the distribution of forests (and the use of forest products) varies
substantially among countries, and (ii) the area of forested land associated with the consumption of
goods and services is a crude (and difficult to measure) indicator.
Instead, we use a more nuanced indicator, namely “human appropriation of net primary production”
(HANPP), which has been proposed as an alternative planetary boundary that integrates four of the
current boundaries46. These boundaries are land-system change and biosphere integrity, in
particular, but also freshwater use and biogeochemical cycles to some degree. HANPP measures the
amount of biomass harvested through agriculture and forestry, as well as biomass that is killed
during harvest but not used, and biomass that is lost due to land use change47. It may be compared
to the potential net primary production (NPPpot) that would exist in the absence of human activities,
to arrive at a useful planetary boundary. It has been suggested, for instance, that HANPP should not
exceed 20% of NPPpot (ref. 48), although there is little scientific rationale for this particular threshold.
As a planetary boundary for HANPP, we use a more robust estimate that only 5 Gt C y-1 of NPPpot
remains available for appropriation by humans46. National HANPP data were obtained from Kastner
et al.47 for the year 2007 (the most recent year available), and measure the embodied human
appropriation of net primary production (eHANPP). These data reflect the consumption-based
allocation of HANPP to final biomass products from agriculture and forestry, where trade is
accounted for using physical bilateral trade matrices. According to these data, global eHANPP was
13.2 Gt y-1 in 2007, which is about 10% lower than other published data (e.g. ref. 49) because the
consumption-based data do not include human-induced vegetation fires or the land occupied by
infrastructure. We therefore estimate the planetary boundary for eHANPP to be 13.2 + 5.0 = 18.2 Gt
C y-1 (excluding human-induced fires and infrastructure). This value yields a per capita boundary of
2.62 t C y-1, which is roughly equivalent to setting the boundary at 33% of NPPpot.
We acknowledge that although the new boundary for land-system change defined by Steffen et al.24
is currently being transgressed, the global boundary for eHANPP is not46. In part this reflects the
difference between a stock-based indicator (forest area) and a flow-based indicator (eHANPP), as
well as the inclusion of agriculture within eHANPP. Given these differences, the boundary based on
eHANPP may be viewed as less strict than the boundary based on forest area defined by Steffen et
al.24
|
2.5 Ecological Footprint
The ecological footprint measures how much biologically productive land and sea area a population
requires to produce the biotic resources it consumes and absorb the CO2 emissions it generates,
using prevailing technology and resource management practices50. It is the sum of six components
(cropland, forest land, fishing grounds, grazing land, built-up land, and carbon land), and may be
compared to biocapacity (the total available area of biologically productive land and sea area).
Although widely used, the ecological footprint has also been widely criticised51-53. A review of the
footprint based on a survey of 34 internationally-recognised experts and an assessment of more than
150 papers concluded that the indicator is a strong communications tool, but that it has a limited
role within a policy context54. Three frequently-cited criticisms of the ecological footprint include: (i)
comparing a nation’s total footprint to its national biocapacity introduces an anti-trade bias that is
particularly unfair to small countries51,52; (ii) the method used to translate CO2 emissions into land
area (which is based on the hypothetical forest area required to assimilate emissions) exaggerates
the size of the footprint, as more land-efficient methods could be devised53; and (iii) as an aggregated
indicator of resource use with a single sustainability threshold, the footprint provides no information
on when specific ecological limits might be reached54
.
Nevertheless, the ecological footprint remains a well-known indicator of strong sustainability that is
frequently cited in studies questioning the sustainability of global resource use55. We therefore
include it for comparison with the downscaled planetary boundary indicators. However, we address
the first criticism by only comparing a country’s per capita ecological footprint to an equal per capita
share of global biocapacity. The other two criticisms remain, but carry somewhat less weight in our
analysis given that the footprint is used alongside indicators for specific ecological limits (i.e. the
planetary boundaries).
Per capita ecological footprint data and global biocapacity data were obtained from the Global
Footprint Network56. The ecological footprint data account for trade by adding imports and
subtracting exports (resulting in a measure of apparent consumption). The data indicate that the
world average footprint is 2.65 global hectares (gha) of land per capita, which is 50% above global
biocapacity of 1.72 gha per capita.
|
2.6 Material Footprint
The material footprint, also known as “raw material consumption” (RMC), measures the amount of
used material extraction (minerals, fossil fuels, and biomass) associated with the final demand for
goods and services, regardless of where that extraction occurs. It includes the upstream (embodied)
raw materials related to imports and exports, and is therefore a fully consumption-based measure57
.
Like the ecological footprint, it is an indicator of strong sustainability that does not link directly to a
planetary boundary. However, we include it in our analysis as material use is an important indicator
of the environmental pressure exerted by socioeconomic activities58, and a maximum sustainable
level has been proposed by various authors55,59-61
.
For instance, Dittrich et al.59 suggest that global material extraction should not exceed 50 Gt y-1, and
propose a per capita limit of 8 t y-1 by 2030. This limit was also adopted in a high-profile analysis of
the sustainability of humanity’s environmental footprint55, while UNEP’s International Resource
Panel recommends a per capita target of 6–8 t y-1 by 205061. A more recent analysis by Bringezu60
,
which uses higher population growth projections, suggests a per capita target value of 5 t for the
year 2050, with a range of 3–6 t. This target value is based on a return to year 2000 material use,
which was 50.8 Gt. We adopt a global target of 50 Gt y-1, as it is a common denominator in all the
analyses, although we caution that the literature is not very mature in this area. This value leads to a
per capita target of 7.2 t y-1, assuming a world population of 7 billion people. National material
footprint data were obtained from the Eora MRIO Database32,33, based on the study by Wiedmann et
al.57, and are for the year 2008 (the most recent year with complete data).
|
2.7 Other Boundaries
Biosphere integrity is not explicitly included in the analysis due to the large difficulty in measuring
and downscaling both functional and genetic diversity. It is represented, to some degree, however
by the indicator used to measure land-system change (i.e. eHANPP). The stratospheric ozone
depletion boundary is expressed as a <5% reduction in stratospheric ozone concentration. This
boundary could theoretically be included in a similar way to the climate change boundary (e.g. based
on the targets of the Montreal Protocol). However, we have not included it because (a) the emission
and management of ozone-depleting substances lies outside the scope of the decision-making of the
average person, and (b) the Antarctic ozone hole is recovering as a result of the Montreal Protocol62
.
Ocean acidification is not included as a separate boundary since it is driven by climate change, and
thus the corresponding pressure indicator (i.e. CO2 emissions) is already fully accounted for in the
analysis. According to Steffen et al.24, the ocean acidification boundary “would not be transgressed if
the climate-change boundary of 350 ppm CO2 were to be respected”.
|
|
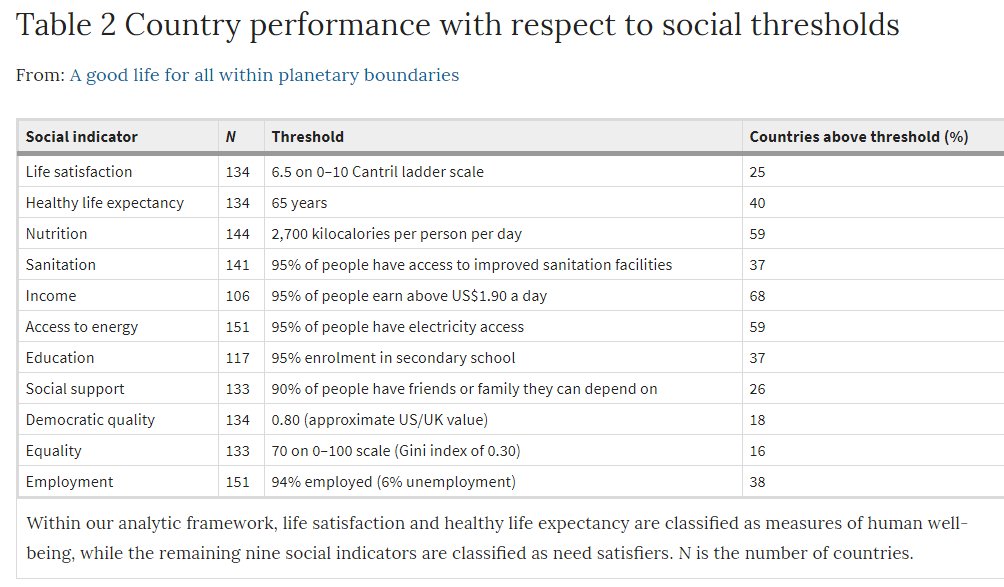
Establishing Social Thresholds
|
|
3.1 Life Satisfaction
There are a number of different approaches to measuring subjective well-being. The most widely used in practice is probably the life satisfaction (or evaluative) approach, which relates well-being to an individual’s subjective appraisal of how his or her life is going63. Evaluative measures may range from a single question about life satisfaction, to multiple questions about different aspects of a person’s life. In our analysis, we use a single life satisfaction measure known as the Cantril life ladder. The data are from the Gallup World Poll, as published in the World Happiness Report64.
The English-language wording of the question is: “Please imagine a ladder, with steps numbered from 0 at the bottom to 10 at the top. The top of the ladder represents the best possible life for you and the bottom of the ladder represents the worst possible life for you. On which step of the ladder would you say you personally feel you stand at this time?”
A value of 6.5 out of 10 was chosen to represent the minimum threshold for this indicator. This value is slightly lower than the 7 out of 10 value that is often chosen to indicate a “high” level of human well-being65. The lower threshold was used here because scores derived from the Cantril ladder question were found to be 0.5 points lower on average than scores derived from the question used by many statistical agencies (a variant of “Overall, how satisfied are you with your life nowadays?”)
|
|
TVM commentary: In the TVM framing for management and accountability, life satisfaction is a result. It is therefore a part of the computation of the STATE of Social Capital. In much of the TVM development process 'life satisfaction' has been labelled 'happiness'.
|
|
3.2 Healthy Life Expectancy
We measure physical health using “healthy life expectancy at birth” (HALE), an indicator that measures the number of years that an individual is expected to live in good health (without major debilitating disease or infirmity). This indicator is extremely closely related to life expectancy at birth: HALE is on average 9 years lower than overall life expectancy, with a standard deviation of 1.
We have set the lower HALE boundary at 65 years of healthy life. Although this threshold might seem on the high side, it is within grasp of most countries. In 2011, 40% of the countries for which data were available for this indicator had already achieved the threshold. Moreover, life expectancy is increasing in many countries at a rate that outpaces both economic and resource use growth, suggesting that high healthy life expectancy can be achieved at lower levels of resource use over time66.
We use HALE data calculated by the authors of the World Happiness Report64, which are based on data from the World Health Organization, World Development Indicators, and statistics published in academic articles.
|
|
TVM commentary: In the TVM framing for management and accountability, a healthy life expectation is important. The TVM computation starts off with the idea that a human life at birth has a value of 1 million units. Over a lifetime this number depreciates to zero (straight line for simplicity). For a life of 80 years the annual depreciation is 12,500 units. The STATE of Human Capital depends on demographics (that is the age profile of the population) and this dimension of human capital is valued at the depreciated value of each person.
|
|
3.3 Nutrition
We measure nutrition using the “food supply” indicator compiled by the UN Food and Agriculture Organization67. This indicator is measured in kilocalories (kcal) per capita and per day, and represents an average calorific intake of food and drink.
The physiological requirements for the average adult range between 2100 and 2900 kcal per day (for average women and men and moderate physical activity). However, the calorific requirements associated with heavy manual labour or athletic activity can exceed these levels substantially68. An average of 2500 kcal per person per day can thus be considered an individual minimum average level. We have used 2700 kcal per person per day as a population-wide threshold, to allow for some inequality in distribution, since a significant fraction of the population eating a larger share of food could result in a significant fraction facing undernourishment or hunger below this level 69,70
.
|
TVM commentary: In the TVM framing for management and accountability, nutrition means food. It is sometimes said, that 'you are what you eat'. Food is incredibly important both because it is an essential part of a person's cost of living, but also because the production of food has very important economic impacts and even more important, significant environmental impacts. Improving nutrition has both positive and negative impacts, BOTH must be taken into account.
The TVM Standard Value Profile (SVP) associates the nutritional value of food with the socio-enviro-economic impact. Healthy nutritional food has a positive impact on Social Capital. At the same time, the supply chain for food has all sorts of impacts that degrade Natural Capital. These include the conversion of tropical rainforest from its valuable natural state into various forms of monoculture that are good for economic profit but bad for Natural Capital
|
Open L0700-SS-FOOD
|
3.4 Sanitation
The sanitation indicator in our analysis measures the percentage of the population using improved sanitation facilities. A staggering 2.4 billion people, or 35% of the global population, currently lack access to improved sanitation facilities, with nearly 1 billion people practicing open defecation71.
Raworth17 argues from a rights-based approach that 100% of the population should have access to improved sanitation because it is a fundamental aspect of a life free of deprivation. The target adopted in the Millennium Development Goals was to halve the proportion of people living without improved sanitation by 2015 72, which would have provided access to about 80% of the global population had it been achieved. Although we believe that 100% of the population should have access to improved sanitation facilities, we have chosen a threshold of 95% for this indicator in recognition of the difficulty associated with extending universal access to the last 5% of a population, often located in very rural areas (few countries have actually achieved this goal).
The data used in our analysis are from the World Bank's World Development Indicators73
.
|
|
TVM commentary: In the TVM framing for management and accountability, sanitation is an element of Locational Capital. A place with a high level sanitation infrastrucure and services enhances Social Capital.
|
|
3.5 Income
The very first target specified in the Sustainable Development Goals is to “eradicate extreme poverty for all people everywhere, currently measured as people living on less than $1.25 a day”74. We adopt this well-known measure as our income indicator, but use the latest World Bank data which define the poverty threshold at $1.90 a day using 2011 international prices73.
Although we use this standard indicator, we also recognise that many argue this threshold is too low75. Given that the data are relatively sparse and not available for most high-income countries, we calculated the average value over three years (2010–2012), and made the assumption that high-income countries (as defined by the World Bank) where no data are provided have achieved the target of eradicating extreme poverty. Although the goal is clearly to have 100% of the population living above the $1.90 a day line, we use a threshold value of 95% in our analysis, given that not many countries report this indicator above 95%. In effect, we assume that values above 95% are equivalent to eradicating extreme poverty.
|
|
TVM commentary: Income is an important benefit for the recipient, but a crital cost for the organizations that are paying. Income is a critical part of the reason why inequality has emerged as one of the key societal issues in the last 40+ years. Accordingly, in the TVM framing for management and accountability, the profile of payroll is one of the key elements of information needed to assess performance. Over the past 40+ years, total income has increased but the distribution of this income has favored the top earners, with wages for the vast majority of people flatlining.
|
Open L0700-SS-PAYROLL
|
3.6 Access to Energy
Around 1.1 billion people currently do not have access to electricity. Another 2.9 billion people rely on wood or other biomass to cook food, resulting in 4.3 million deaths per year that are attributable to indoor air pollution76. The data used in our analysis measure the percentage of the national population with access to electricity. They were obtained from the World Bank’s World Development Indicators73, and are for the year 2012 (data for 2011 were not available). Similar to the other percentage indicators, a threshold of 95% electricity access was used.
|
|
TVM commentary: With respect to energy, there are two issues (1) some people do not have access to energy, which is a serious issue; and, (2) some people are consuming an amount of energy that is completely unsustainable and doing immense damage to the environment. In conventional money terms, more electric power generated using fossil fuels is the cheapest way to give more people access to energy, but this aggravates an already dangerous situation with respect to the existential risk of accelerating environmental degradation.
|
Open L0700-SS-ENERGY
|
3.7 Education
Secondary school enrolment was chosen as our education indicator. We focused on secondary
education for two reasons. First, without receiving more subject- or skill-oriented instruction during
their teenage years, not only are young people ill-prepared for tertiary education or the workforce,
but they are also more at risk of activities with negative effects on well-being such as juvenile
delinquency, teenage pregnancy, and radicalisation by militants77. Second, secondary education has
the potential to dramatically reduce population growth based on evidence suggesting that women in
developing countries who complete secondary education average at least one child fewer per
lifetime than women who only complete primary education78. The data used in our analysis measure
gross enrolment in secondary education (i.e. the ratio of total enrolment, regardless of age, to the
population that are of secondary-school age). Ideally we would have used net enrolment data (i.e.
the ratio of enrolled children who are of secondary-school age, to the population that are of this
age). However, these data were not available for enough countries. The gross enrolment data that
we have used are from the World Bank's World Development Indicators73. Similar to the other
percentage indicators, a threshold of 95% was chosen for this indicator, in recognition that universal
access to education does not imply 100% enrolment.
|
3.8 Social Support
The importance of social support for achieving long, happy, and healthy lives was firmly established
nearly half a century ago79. The social support indicator used in our analysis is a measure of whether
or not people have someone to count on in times of need. It is the national average of binary
responses (either 0 or 1) to the question “If you were in trouble, do you have relatives or friends you
can count on to help you whenever you need them, or not?” The data are from the Gallup World
Poll, as published in the World Happiness Report64
.
A value of 0.9, or 90%, was chosen as the minimum threshold for this indicator. This choice, which is
lower than the other percentage indicators, was based on our identification of two confounding
factors that suggest a small share of negative responses to the above question may be acceptable.
First, reducing the complexity of a respondent's close relationships into a simple yes/no question
likely leads to responses based on the availability heuristic, which is biased towards emotionally
charged memories80. Second, the data do not differentiate between long-term, involuntary social
isolation and short-term lack of social support. Lack of support in the short term can arise due to
changing circumstances, which may be voluntary (i.e. moving to a new region for work). Although
long-term lack of support unambiguously exacts a high social cost, short-term lack of support is
arguably not a major policy concern.
|
3.9 Democratic Quality
Democracy is a collection of norms, institutions, and organisational arrangements from which
individuals and communities exercise power over their collective governance. While guarding
against discourses that reinforce structures of elite power81,82, democratic rights such as free
association, free speech, and transparent policy-making are vital for enabling social participation and
personal autonomy13. Following the approach taken in the World Happiness Report64, the indicator
of democratic quality used here is comprised of an unweighted average of two Worldwide
Governance Indicators: voice and accountability, and political stability83. These indicators are built
upon multiple sources (e.g. household surveys and interviews with experts, firms, and nongovernmental
organisations), and are scaled between roughly -2.5 (poor democratic quality) and 2.5
(strong democratic quality). A threshold along this scale is of course normative, but we have chosen
0.80, as this is the approximate value for the United States and the United Kingdom—two democratic
systems that are by no means the highest performing, but are nonetheless well-known in terms of
their strengths and weaknesses.
|
3.10 Equality
Evidence for high-income countries suggests that more equal societies have fewer health and social problems than less equal ones84. We chose the Gini coefficient as our measure of equality, using equivalised (square root scale) household disposable income (i.e. after taxes and transfers). The data are from the October 2014 release (v5.0) of the Standardized World Income Inequality Database85. Given that the data are relatively sparse, particularly for recent years, we used data for 2005, the most recent year with data for a large number of countries. A maximum Gini coefficient of 0.30 was chosen as our threshold. To be consistent with our convention of a higher value on the social indicators representing better performance, we calculated equality as one minus the Gini coefficient (thus the threshold is a minimum of 0.70). The threshold value falls in between the Gini coefficients associated with “low” and “medium” total income inequality (0.26 and 0.36, respectively), as characterised by Piketty86. It also roughly corresponds to the level observed in the United States
during the late-1970s.
|
|
TVM commentary: In the TVM framing for management and accountability, equality per se does not result in very much change. In a system where there is more equality, the benefits are tangible and substantial. This is because a system where there is more eqality is likely to make better decisions and less inequality also results in increased social benefit
|
Open L0700-XR-Inequality
|
3.11 Employment
A high level of employment is generally regarded as one of the most important indicators of national policy success. For an individual, employment enables social and economic autonomy13, and has
been shown to be a strong determinant of subjective well-being87,88. We measure employment as one minus the unemployment rate, where the latter refers to the share of the labour force that is without work but available for and seeking employment. To ensure comparability among countries, we use harmonised unemployment data from World Bank’s World Development Indicators73. Some level of frictional unemployment is inevitable in any well-functioning economy, and is in fact desirable to allow workers to transition between jobs. This short-term unemployment differs from structural unemployment, where there is a mismatch between jobs and employee skills, or cyclical unemployment, which may occur due to a fall in the aggregate demand for goods and services 89
.
We chose a threshold of 6% unemployment (i.e. 94% employment) as corresponding to full
employment in our analysis. This level is roughly equivalent to the average non-accelerating inflation
rate of unemployment (NAIRU) for OECD countries90
.
|

|
|
|
|


